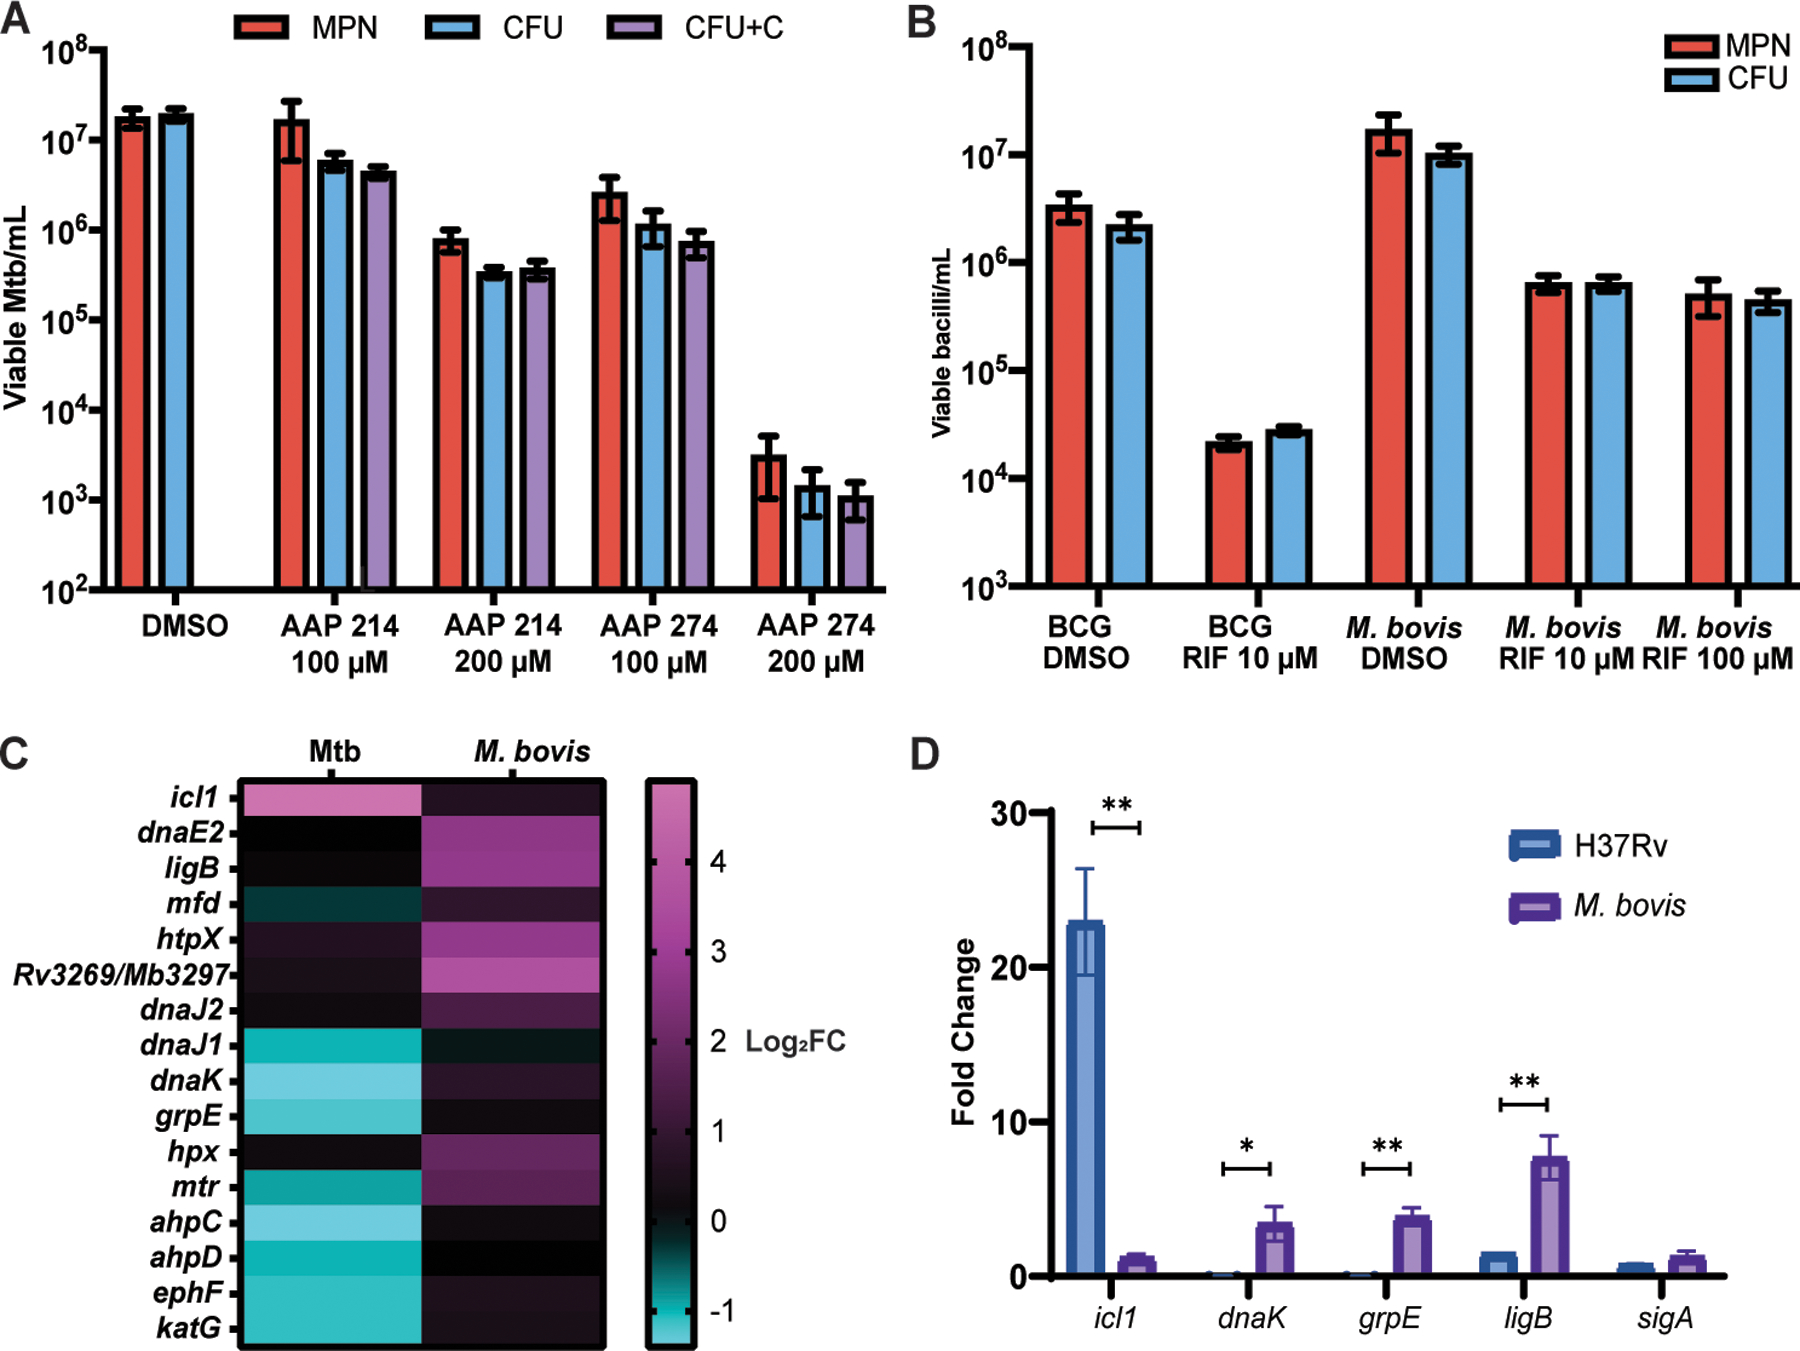
Fig. 5. DD formation is specific to rifamycins in the PBS-RIF model, and M. bovis is unable to enter the DD state in the PBS-RIF model.

(A) Viable cell counts using CFU, CFU with charcoal (CFU+C), and MPN-limiting dilution assays are shown after starvation and 5 days of the exposure to Nα-aroyl-N-aryl-phenylalaninamide (AAP) direct RNA polymerase inhibitors (AAP 214 and 274) or DMSO exposure. Data are representative of 2 experiments with 3 biological replicates each. Data were analyzed using a mixed-effects analysis with Sidak’s multiple comparisons test. (B) Viable cell counts are shown for BCG Pasteur (2 experiments, 3 biological replicates each) and M. bovis (3 experiments, 3 biological replicates each, except R100, which is 2 experiments, 3 biological replicates each) after starvation and 5 days of RIF or DMSO exposure. Data were analyzed using a two-way ANOVA with Sidak’s multiple comparisons test. (C) A heat map of log2 fold change in transcripts is shown after PBS starvation without RIF exposure as compared to LP in Mtb and in M. bovis, according to RNAseq. (D) Fold change in icl1, dnaK, grpE, ligB, and sigA transcripts are shown as determined by qPCR after 4 weeks of PBS starvation and without RIF exposure as compared to LP cells, normalized to 16s rRNA, in H37Rv and M. bovis. Data were analyzed using multiple paired t-tests with Holm-Sidak correction for multiple comparisons. *adj p < 0.05, **adj p < 0.01.
