
Fig. 6. DD formation is correlated with intermediate degrees of oxidative stress.
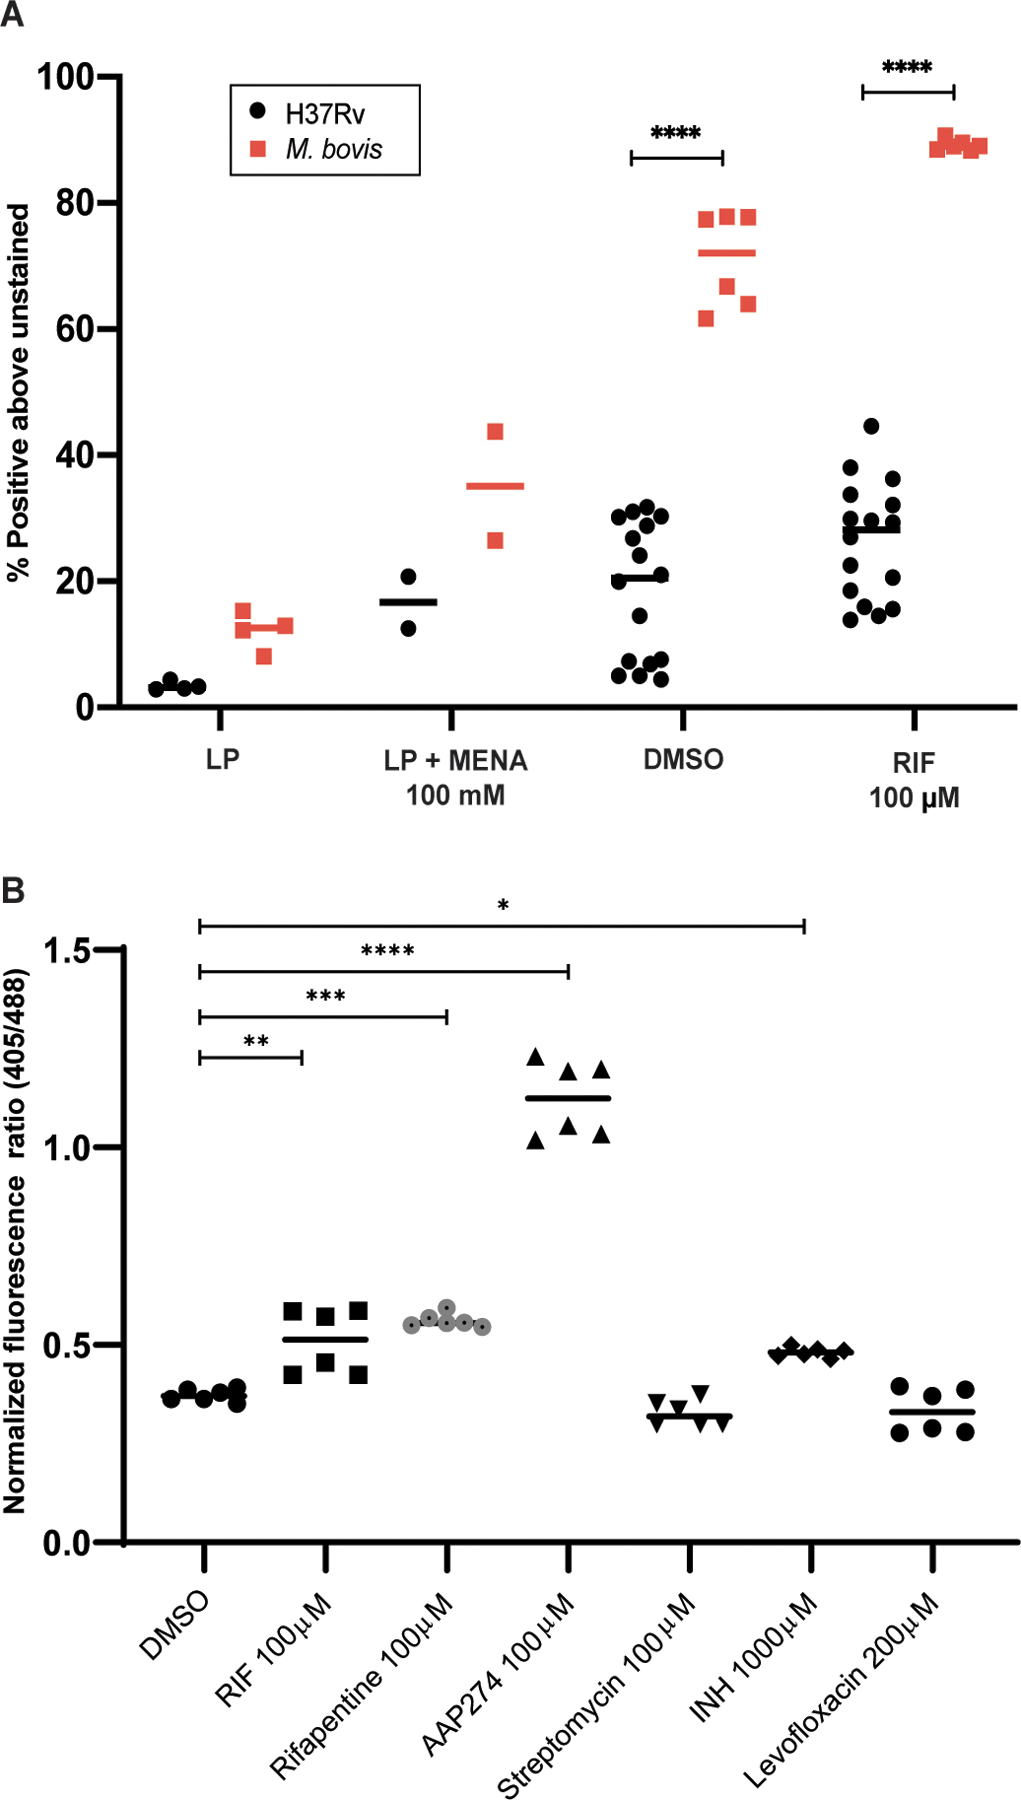
(A) Flow cytometry analysis is shown after staining M. bovis with CellROX Green as compared with Mtb. M. bovis data are from 2 experiments; Mtb data are as in Fig. 1B. Data were analyzed using a two-way ANOVA with Sidak’s multiple comparisons test. (B) Flow cytometry analysis is shown after starvation and exposure to RIF, rifapentine (RFP), isoniazid (INH), streptomycin (STR), levofloxacin (LVX), and AAP274 of H37Rv with the mrx1-roGFP2 plasmid. Data are representative of 2 experiments with 3 biological replicates each. Data were analyzed using a one-way ANOVA with Tukey’s multiple comparisons test. *adj p < 0.05, **adj p < 0.01, ***adj p < 0.001, ****adj p < 0.0001.