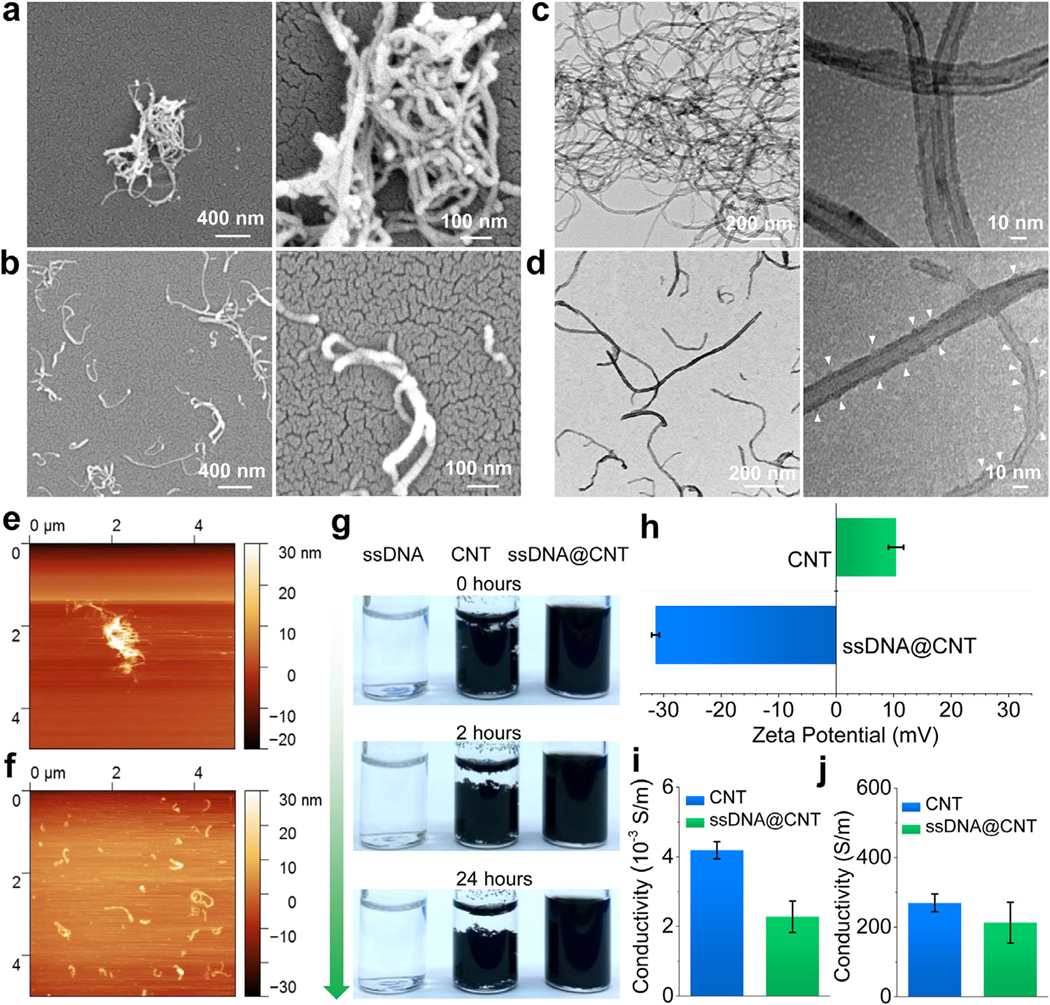
Fig. 2.

Characterization of ssDNA@CNT nanocomposite. SEM characterization of a) CNT and b) ssDNA@CNT nanocomposite. TEM images of c) CNT and d) ssDNA@CNT nanocomposite. AFM mapping of e) CNT and f) ssDNA@CNT nanocomposite. g) Photographs of ssDNA, CNT, and ssDNA@CNT solutions at different times after sonication. h) Zeta potential of CNT and ssDNA@CNT nanocomposites tested by DLS. i) Conductivity tested for CNT and ssDNA@CNT at a concentration of 0.5 mg/mL. j) Conductivities of solid CNT and ssDNA@CNT pellets.
