
Fig. 1.
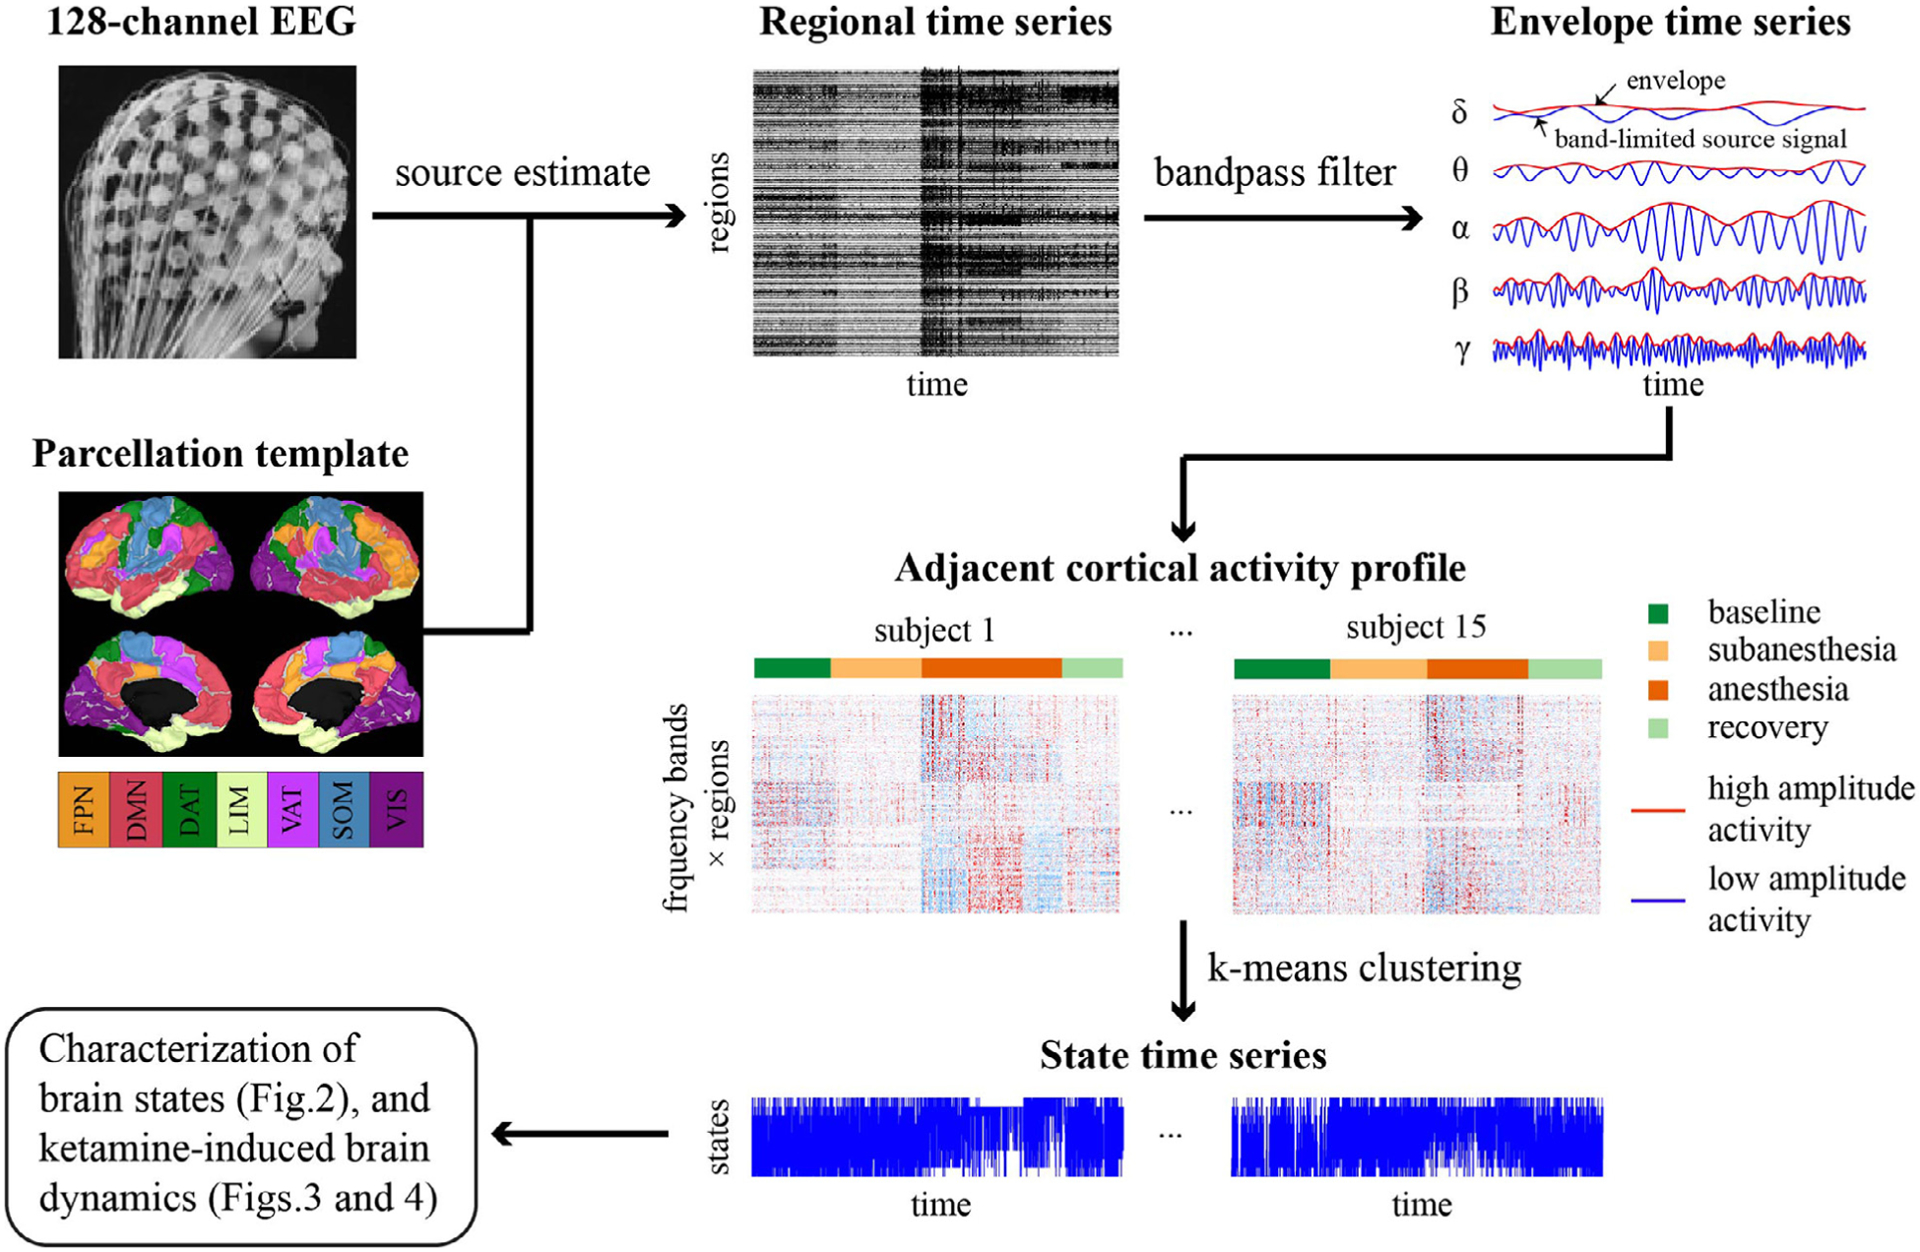
Schematic overview of the analysis pipeline. The 128-channel EEG data of 15 subjects during baseline, subanesthetic and anesthetic ketamine, as well as recovery period, were preprocessed in sensor space and concatenated for the analysis. Cortical sources were estimated using the weighted minimum norm estimation (wMNE) method, followed by the extraction of regional time series by averaging the cortical activity across voxels within each of the 100 regions based on the Yeo atlas. Each region can be matched to one of the seven resting-state networks (RSNs): FPN, frontoparietal network, DMN, default mode network, DAT, dorsal attention network, LIM, limbic network, VAT, ventral attention network, SOM sensorimotor network, and VIS, visual network. Band-limited envelope data were derived from Hilbert transformation and aggregated across all studied periods and subjects. K-means clustering algorithm was applied to generate a discrete set of brain states and the state time series for each studied period and subject. The spectral and spatial properties of the brain states, the temporal dynamics of state time series and their alterations with different dosing of ketamine were subsequently characterized.