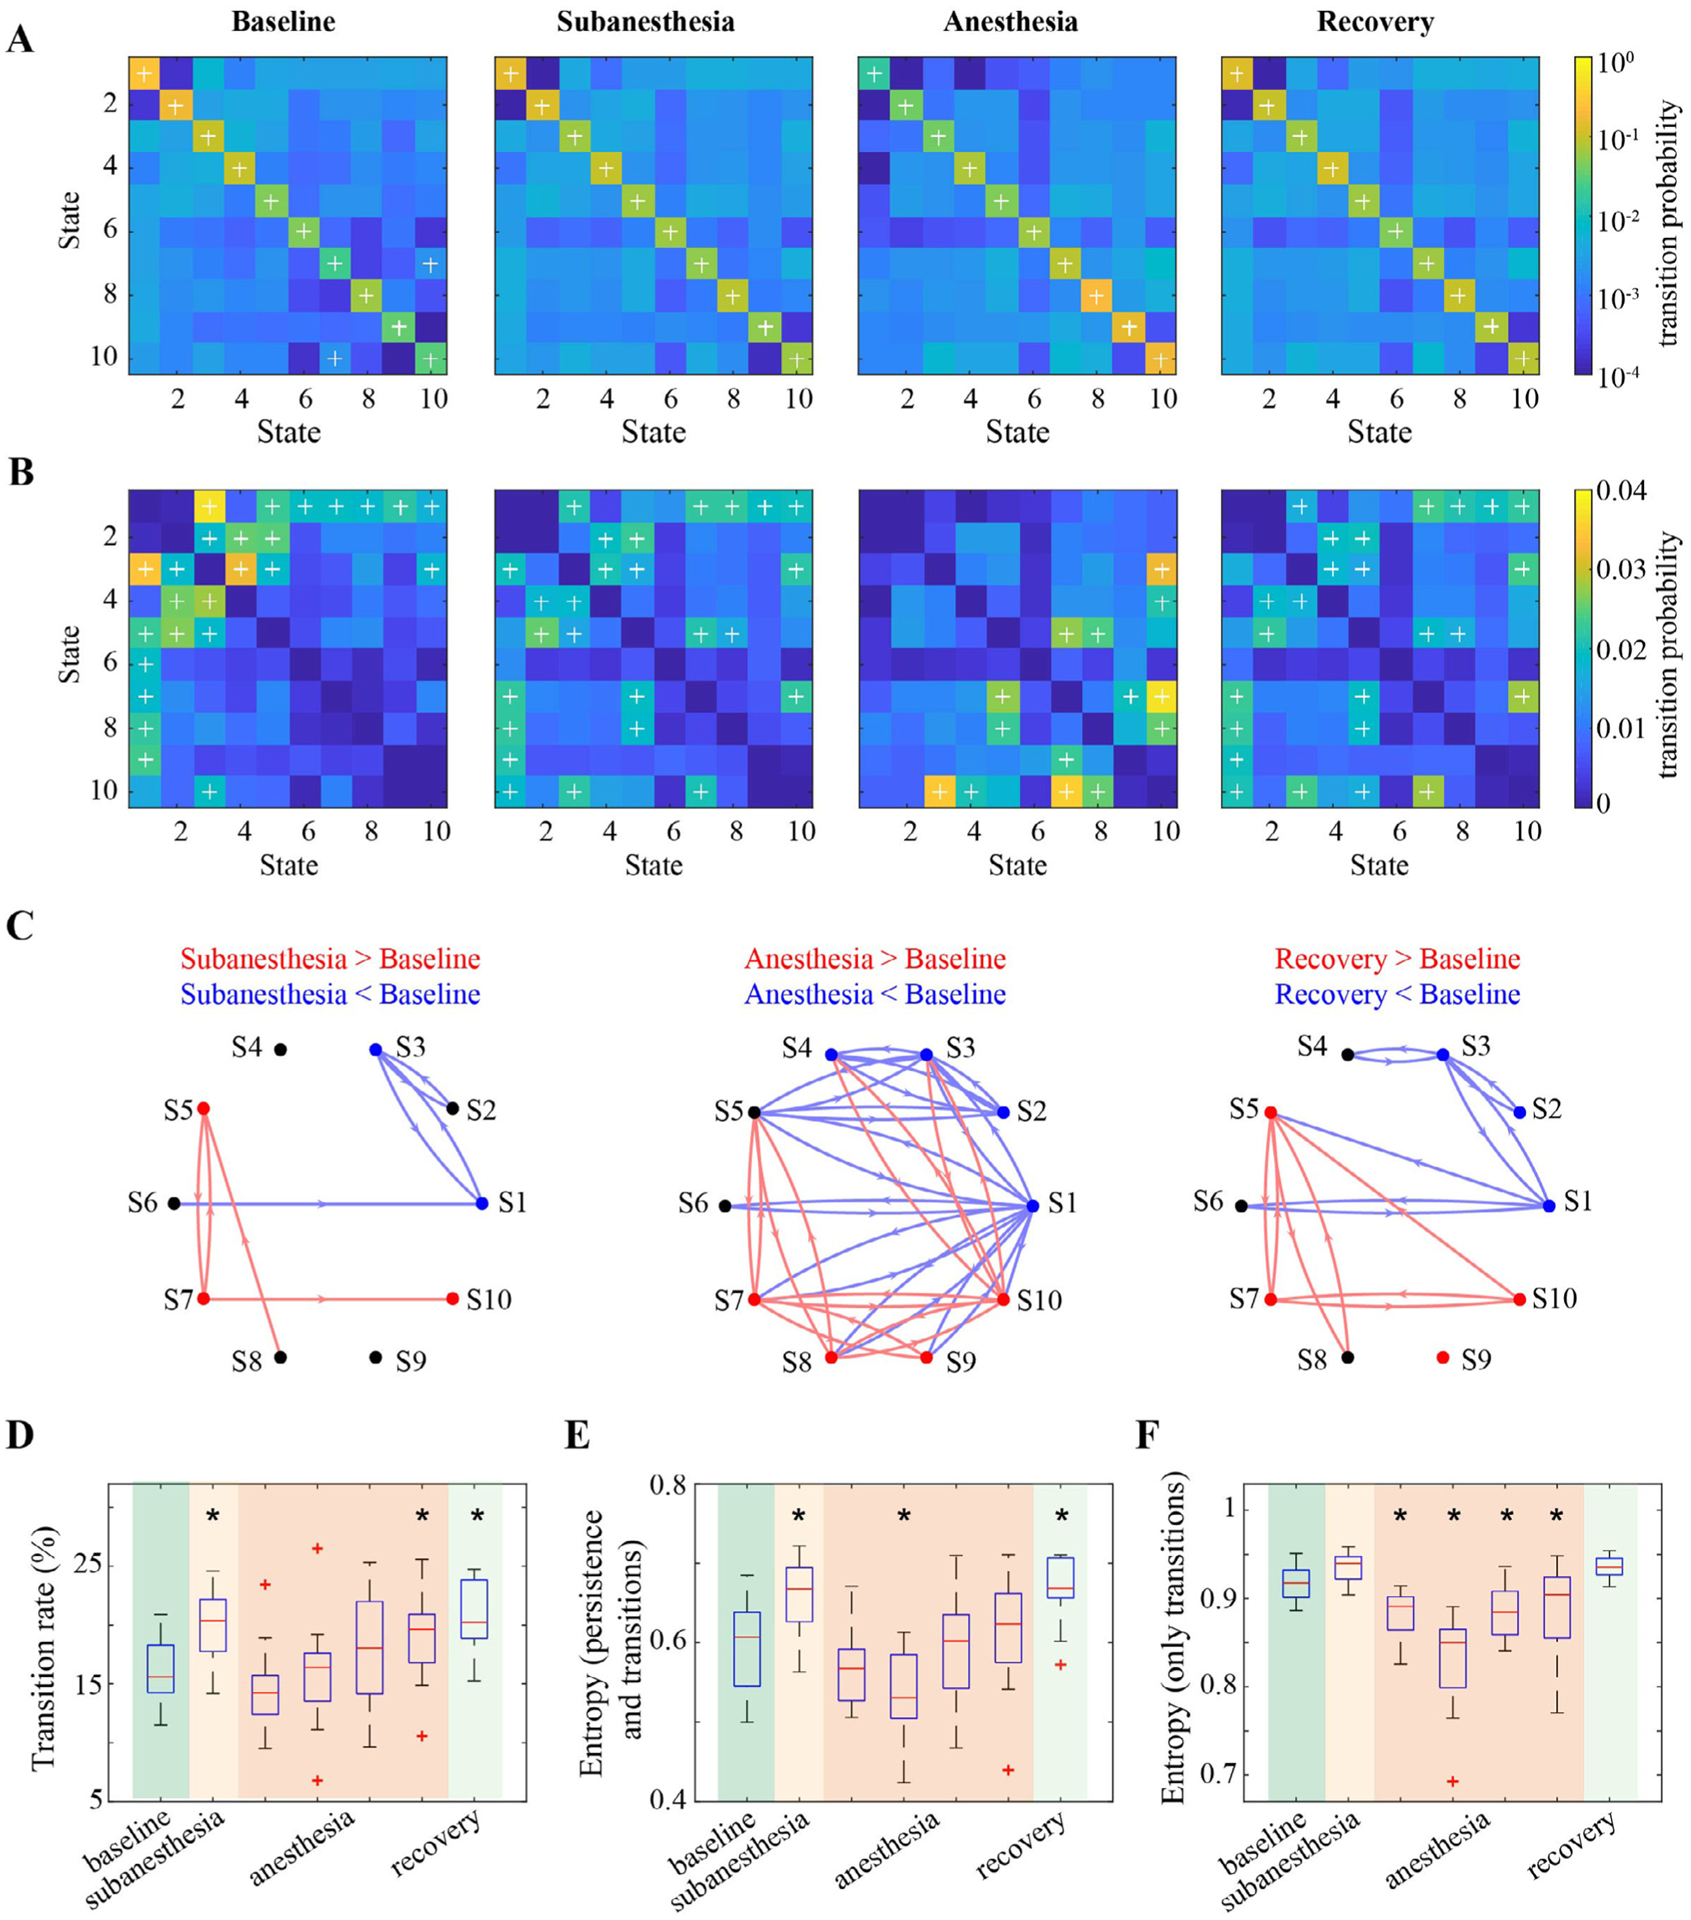
Fig. 4.

The effects of ketamine on state transition dynamics. (A) Group average state transition matrix for each of the studied periods, with each off-diagonal element indicating the probability of transitioning from any state in each row to another state in the given column, while the element on the diagonal line indicates the probability of staying in a certain state. The elements with + indicate the state transitions with the probability statistically higher than those of random transitioning by permutating the temporal order while keeping the occupancy of the states (FDR-adjusted p < 0.05). (B) Group average state transition matrix from the retained state time series after removing the state stays. The elements with + indicate the state transitions with the probability statistically higher than average transition rate (1/90 in this study) (FDR-adjusted p < 0.05, Wilcoxon signed rank test). (C) Changes in state persistence and transition probabilities in subanesthesia, anesthesia, and recovery relative to baseline. Each node indicates a brain state, with different colors denoting statistically higher (red), lower (blue), or no changes (black) in the probability of staying in that state (FDR-adjusted p < 0.05, Wilcoxon signed rank test). The directed arrows in red (blue) denoted statistically higher (lower) probability for that transition (FDR-adjusted p < 0.05, Wilcoxon signed rank test). (D) Changes of transition rate. (E,F) Changes in entropy values associated with state persistence and transition probabilities (E) or state transition probabilities only (F). In D–F, * indicates statistically significant difference relative to baseline (Bonferroni corrected p < 0.05, linear mixed model analysis).
