
Figure 1 |. Nomenclature of Lm cgMLST profiles.
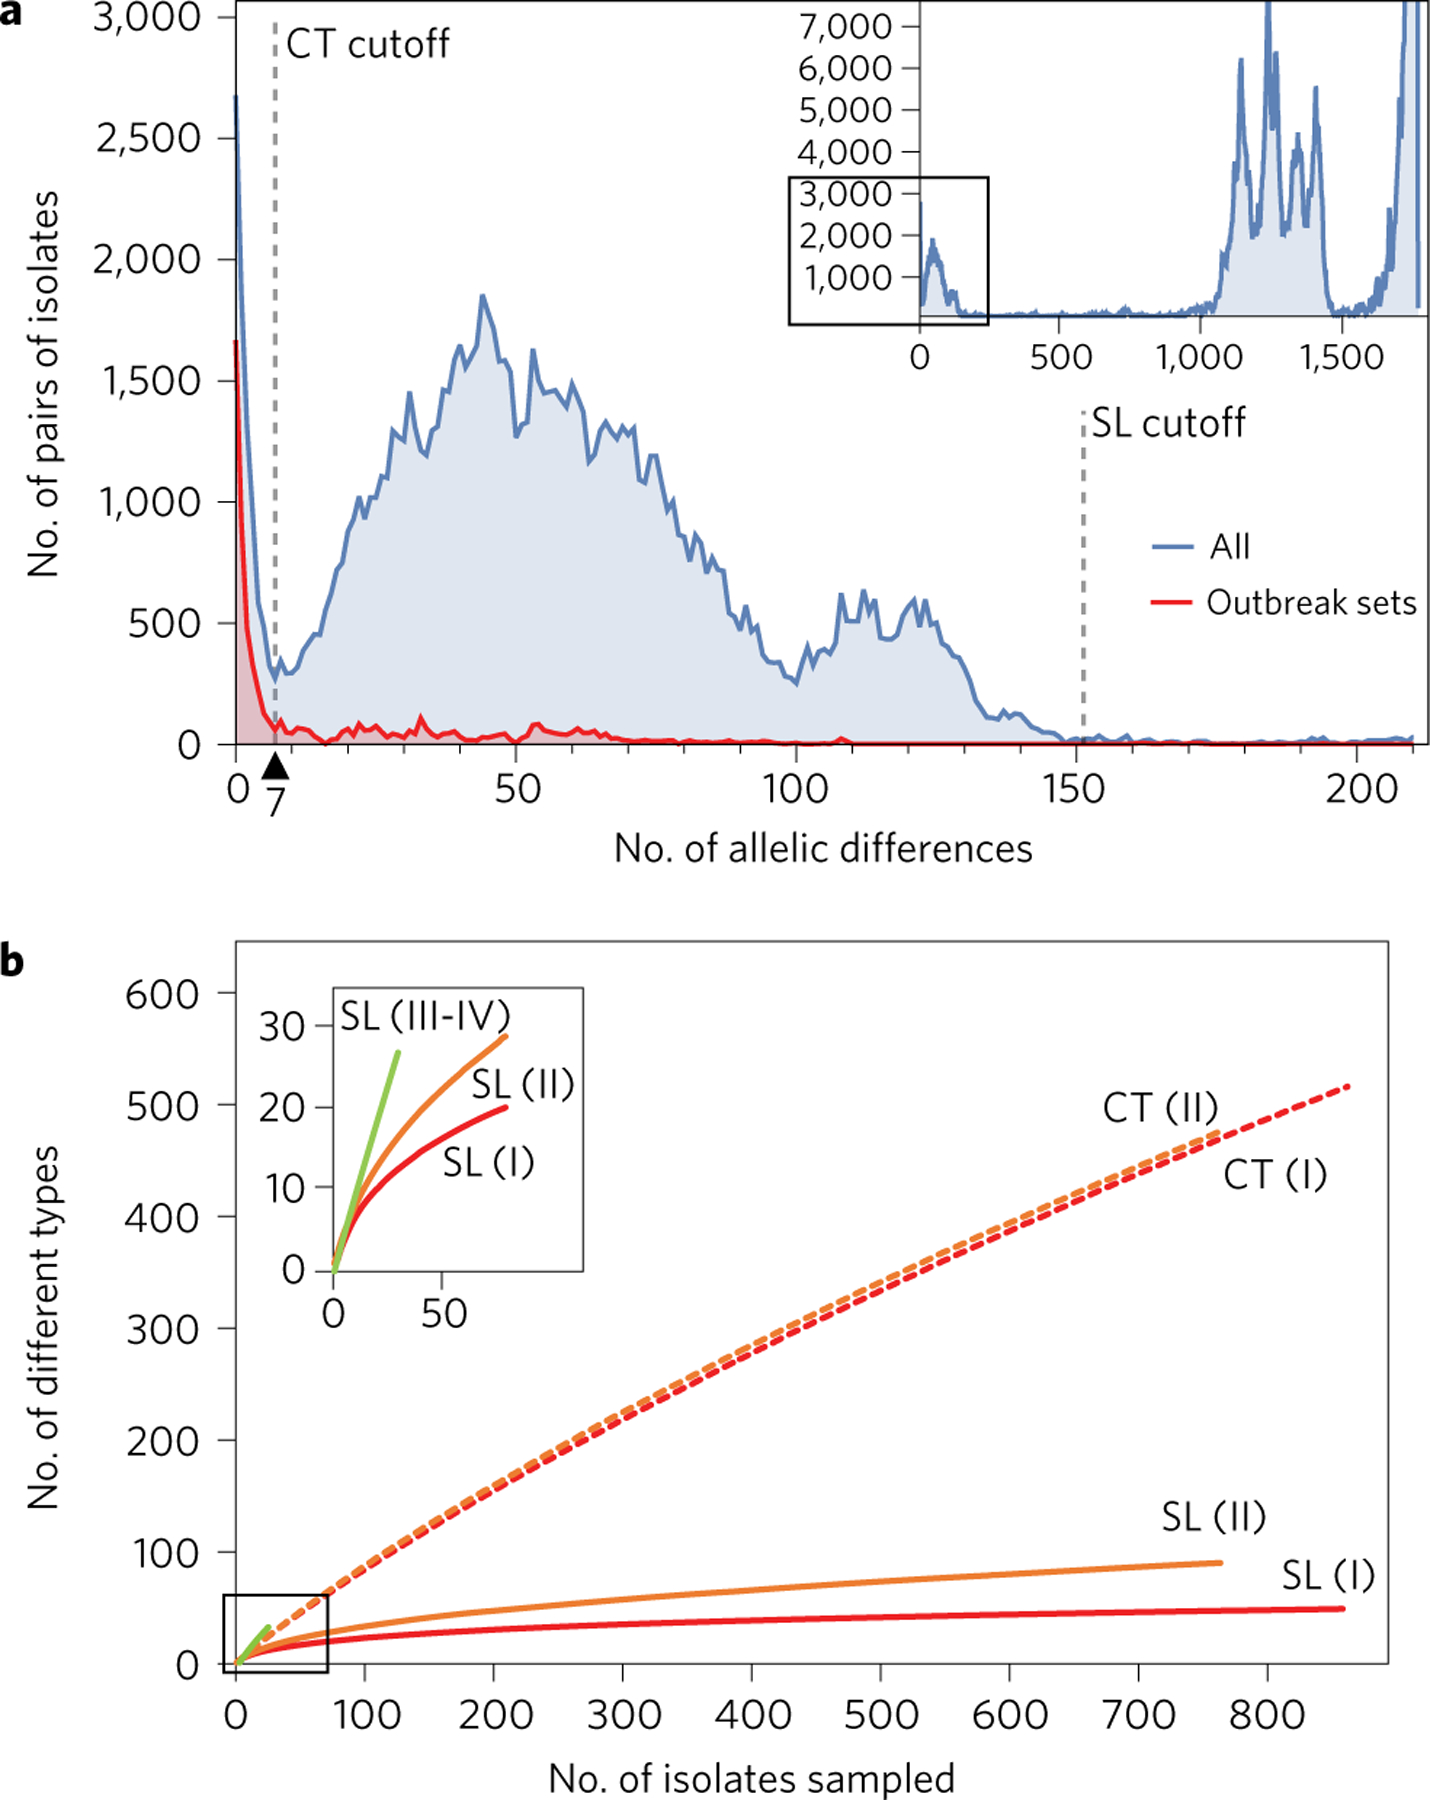
a, Distribution of the number of cgMLST allelic differences between pairs of isolates among the 1,696 genomes (blue) and within 49 sets of epidemiologically related isolates (426 isolates in total; red). Dashed vertical bars represent cutoff values for cgMLST types (CT, 7 allelic mismatches) and sublineages (SL, 150 allelic mismatches). Inset: global data set. Main figure: up to 200 allelic mismatches. b, Rarefaction curves of the number of sublineages and cgMLST types identified, broken down per main phylogenetic lineage (I–IV). Curves were estimated using 100 random samples per point. Inset: zoom on the 0–50 x-axis values. Lineages III and IV were pooled but must be sampled more extensively to determine the shape of the curve.