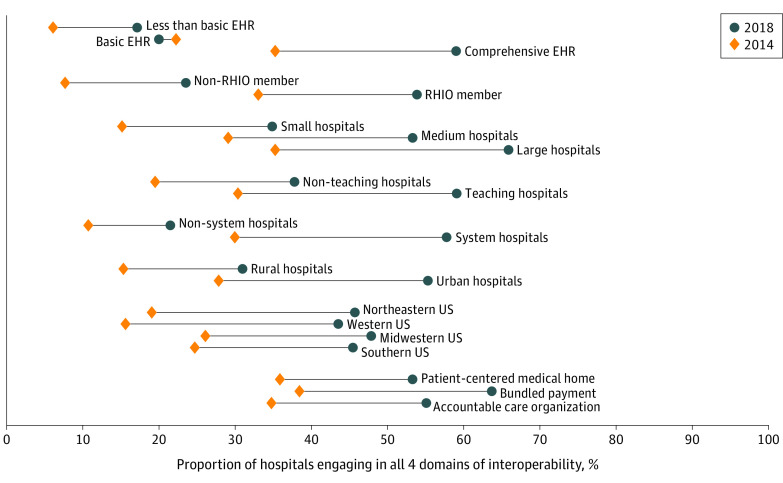
Figure 2. Interoperability Progress From 2014 to 2018 by Hospital Characteristics.
Analysis of American Hospital Association Annual Survey and IT Supplement data, 2014 to 2018. Barbells represent change in hospital engagement in all 4 domains of interoperability from 2014 to 2018 as stratified by hospital demographic characteristics. Orange diamonds indicate interoperability engagement among hospitals in that category in 2014, while dark blue circles represent the same in 2018. EHR indicates electronic health record; RHIO, regional health information exchange organization.

