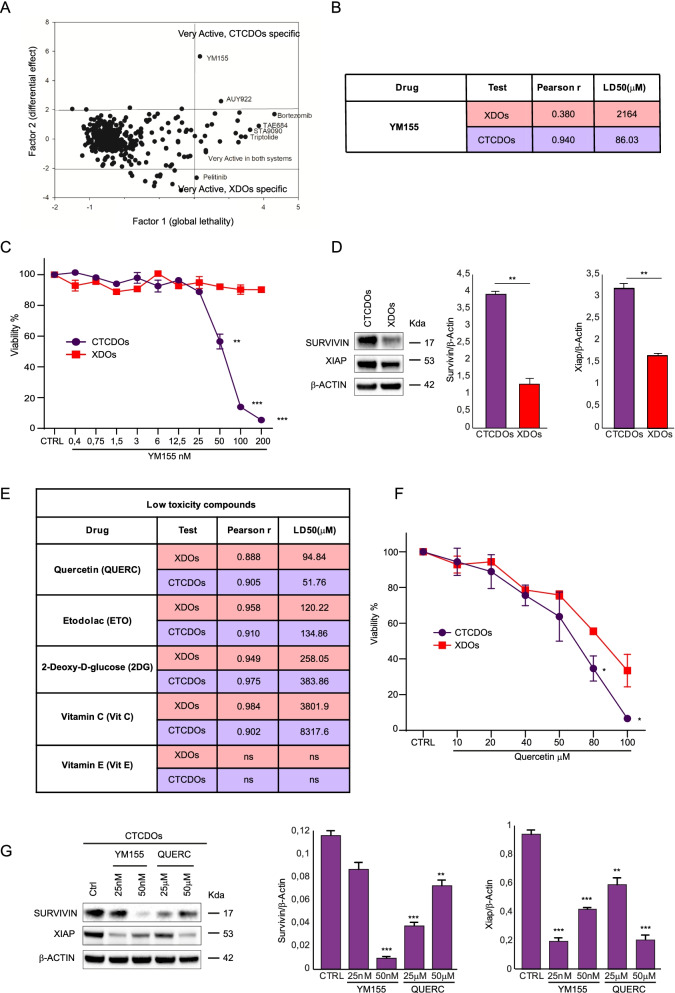
Fig. 5.
CTCDOs show a distinctive therapy response profile. A Principal component analysis (PCA) of cell viability assay performed with anti-cancer compounds (detailed in Additional file 3: Table S2) highlighting drugs very active on CTCDOs and XDOs, respectively. Drugs were used at a 200 nM concentration. B Schematic representation of YM155 potency (LD50, μM) and dose/effect relationship (Pearson r) in XDOs (red lines) and CTCDOs (purple lines). Doses of YM155 are reported in Fig. 5C. C Cell viability of CTCDOs (purple line/circles) and XDOs (red line/squares) treated with YM155 at the indicated concentrations. Values represent the mean ± SD of three independent experiments. **P < 0.01 and ***P < 0.001 by unpaired Student’s t test. D Left: immunoblot analysis of Survivin and XIAP on whole lysates of CTCDOs and XDOs. β-actin was used as a loading control. Right: quantification of immunoblot experiments (three replicates). E Schematic representation of low toxicity compounds potency (LD50, μM) and dose/effect relationship (Pearson r going from 0.88 to 0.98) in XDOs (red lines) and CTCDOs (purple lines). Doses of low toxicity compounds are reported in Additional file 3: Table S2. F Cell viability of CTCDOs- (purple line/circles) and XDOs (red line/squares) treated with quercetin (QUERC) at the indicated concentrations. Values represent mean ± SD of three independent experiments. *P < 0.05 and **P < 0.01 by unpaired Student’s t test. G Left: immunoblot analysis of Survivin and XIAP on whole lysates of CTCDOs treated for 6 days with the indicated concentrations of YM155 and quercetin. β-actin was used as a loading control. Right: quantification of immunoblot experiments (three replicates)

