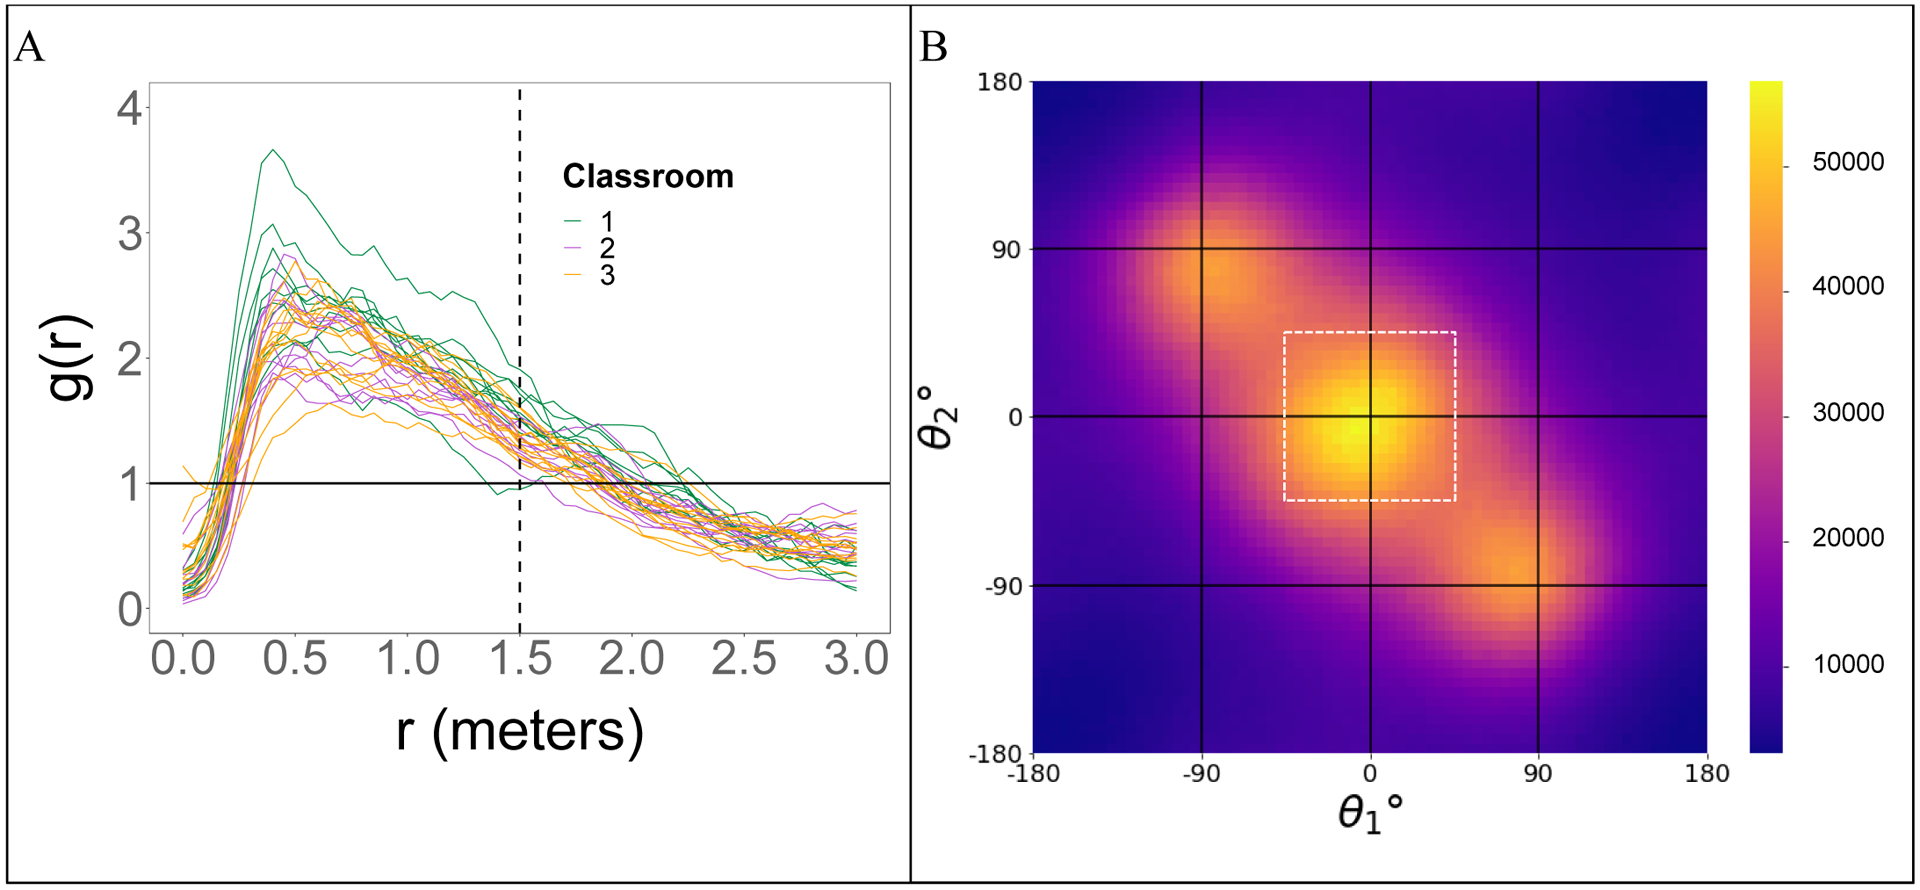
Figure 2. Social contact determination.

Social contact was determined using Ubisense measures of child-to-child proximity (A) and mutual orientation (B). 1A depicts the radial distribution function, g(r), which indicates distances at which the probability of two children being in contact is higher than chance, g(r)=1). Each line depicts one observation day for a given cohort 1B is a heat map indicating the angle of each child, θ1, to all peers, θ2, who are within 1.5 m. The color bar indicates number of tenth-of-a-second observations in 1,000s. Children tend to be face-to-face (|θ1°| & |θ2°| within |45°| of 0°), which was used as the orientation criterion for social contact (white box).
