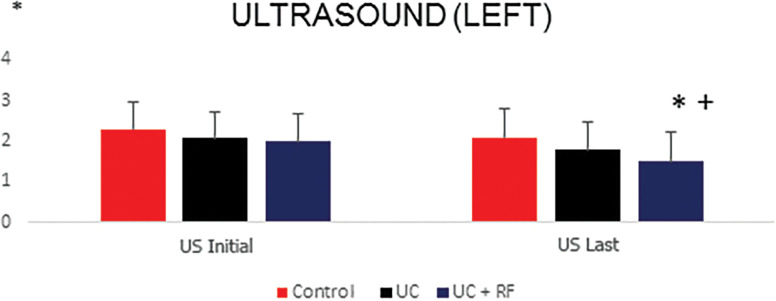
FIGURE 4.
US analysis of the left side. *There was some difference between the UCV+RF versus Control (0.02). When the UCV groups were compared to the UCV+RF group, it was possible to verify that *some difference was identified (p=0.01). Greater decrease of the greasy contingent in the UCV+RF group was verified.
UCV: ultracavitation; UC+RF: ultracavitation and radiofrequency; US: ultrasound

