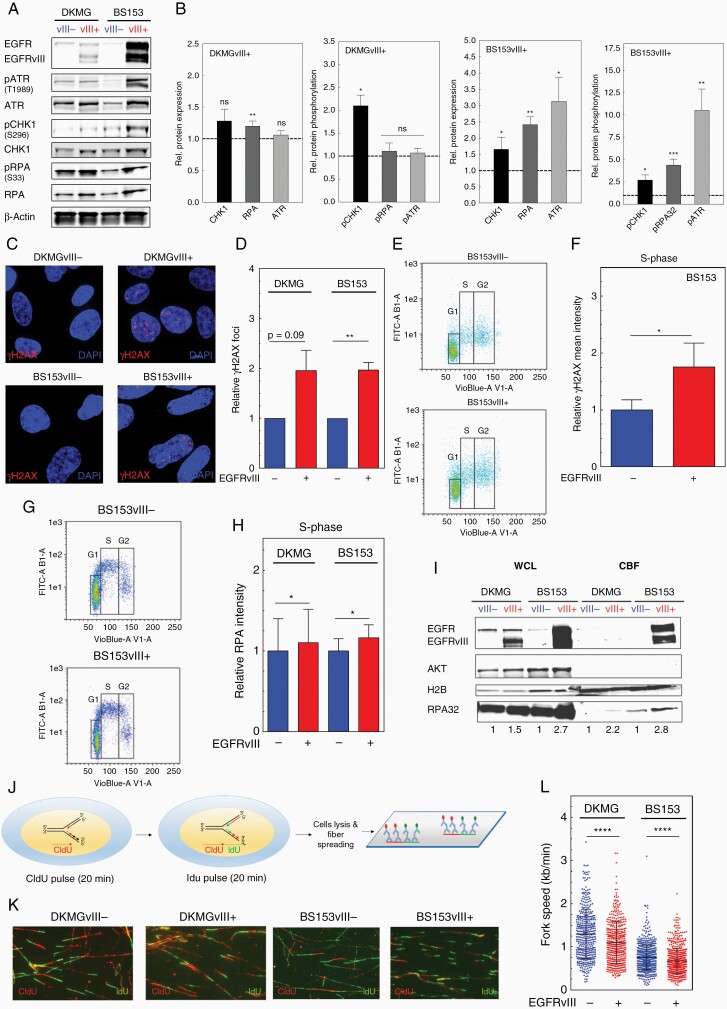
Figure 2.
EGFRvIII expression is associated with replication stress in GBM cell lines. (A) Western blot analysis of RS response markers using specific antibodies, equal numbers of lysed cells were analyzed. β-Actin served as loading control. (B) For quantification the relative expression and phosphorylation values of EGFRvIII+ cells were normalized to the relative values of EGFRvIII− cells (n > 3; mean with SEM; P values are obtained by Wilcoxon Signed Rank test. *P < .05, **P < .01, ***P < .001, ns: not significant). (C and D) Detection of γH2AX foci by immunofluorescence. (C) Representative images (red: γH2AX foci; blue: nuclei (DAPI)). (D) Quantification of γH2AX foci (n = 3; mean with SEM; P values are obtained by Mann Whitney test, *P < .05, **P < .01, ns: not significant). (E and F) Analysis of relative γH2AX mean intensitiy in S-phase cells by flow cytometry. (E) Representative dot plot. DNA was stained with DAPI for cell cycle phase gating. (F) Quantification of γH2AX intensity in S-phase (n = 4; mean with SEM; P values are obtained by Mann Whitney test. *P < .05). (G and H) Analysis of average chromatin-bound RPA (mean intensity) in S-phase cells by flow cytometry. (G) Representative dot plots. (H) Quantification (n = 4; mean with SEM; P values are obtained by Mann Whitney test, *P < .05). (I) Western blot analyzing the level of chromatin-bound RPA32 in chromatin-bound fractions (CBF). Equal protein concentrations of CBF samples were loaded. Whole cell lysate (WCL) samples served as a control for fractionation efficiency. (J–L) DNA fiber assay. (J) Scheme: cells were incubated sequentially with CIdU (red) then IdU (green), followed by lysis and fiber spreading. (K) Representative immunofluorescent images of DNA fibers. (L) Fork speed in kb/min. The dot plot summarizes the quantification of IdU and CIdU incorporation rates (n = 3; mean with SEM; P values are obtained by two-tailed Student’s t-test. ***P < .001).

