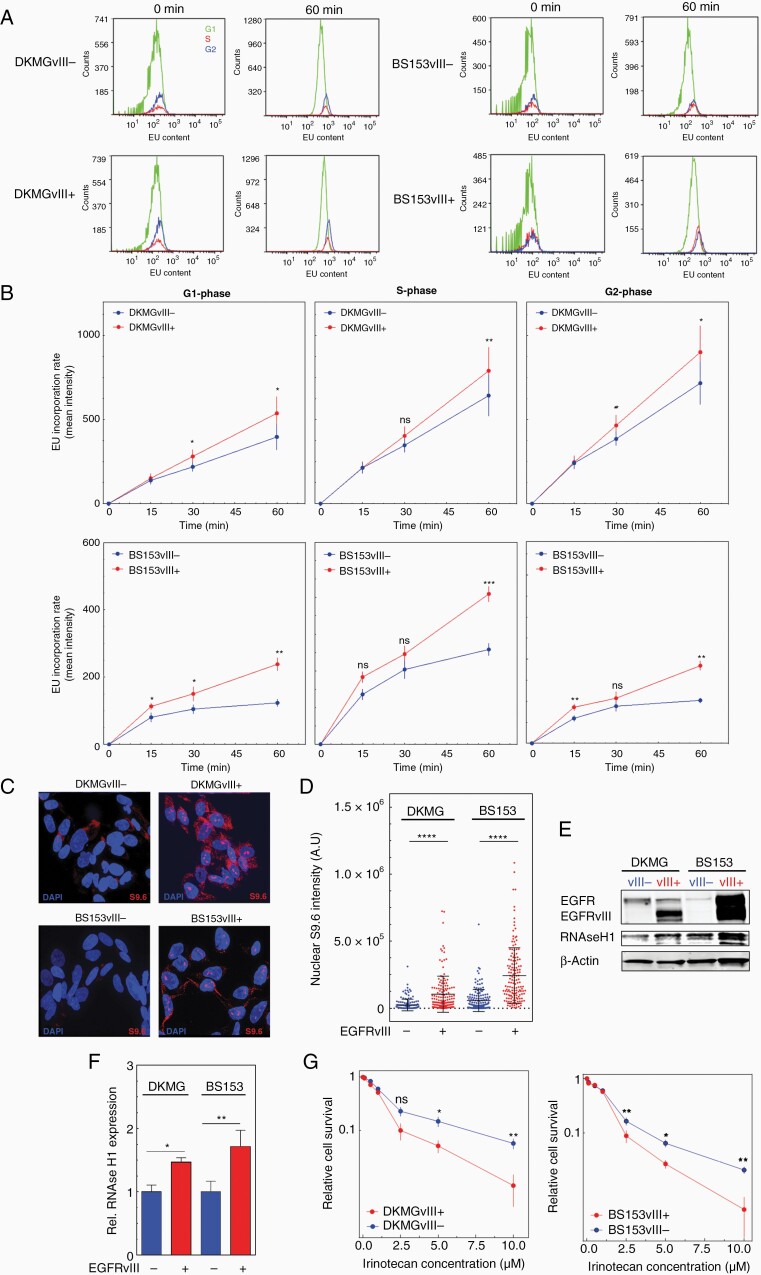
Figure 5.
EGFRvIII expression is associated with increased transcription activity and R-loop formation. (A and B) Transcriptional activity in G1-, S- and G2-cells measured by EU incorporation and flow cytometry. (A) Representative histograms showing kinetics over 60 min of EU treatment. (B) Quantification of EU incorporation rate in G1-, S- and G2-phase cells at different time points (n = 3; mean with SEM; P values are obtained by two-tailed Student’s t-test. *P < .05, **P < .01). (C, D) Analysis of R-loops S9.6 immunostaining. (C) Representative picture (red: S9.6 signal; blue: DAPI) and (D) quantification of nuclear S9.6 intensity (n = 3; mean with SEM; P values are obtained by two-tailed Student’s t-test. *P < .0001; at least 50 nuclei were analyzed per independent experiment). (E) Western blot analysis of RNAse H1 expression. Samples were normalized to cell number. Detection of β-actin served as loading control. (F) Quanification of RNAse H1 expression intensitiy values of EGFRvIII+ cells. The values were normalized to EGFRvIII− cells (n = 3; mean with SEM; P values are obtained by two-tailed Student’s t-test. *P < .05, **P < .01). (G) Cell survival after irinotecan treatment assessed by colony-forming assay (n = 3; mean with SEM; P values are obtained by two-tailed Sudent’s t-test. *P < .05, **P < .01).

