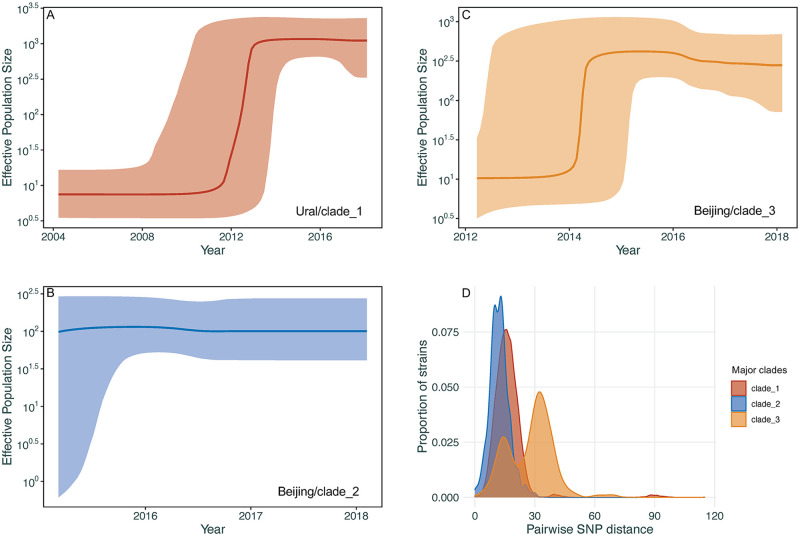
Fig 4.
(A–C) Coalescent Bayesian Skyline plots of the 3 large clades among Ural/lineage 4.2.1 and Beijing/lineage 2.2.1 with specific resistant mutations (detailed in Fig 2B) using an uncorrelated log normal relaxed clock model. The 2 blue lines are the upper and lower bounds of the 95% HPD interval. The x-axis is the time in years and the y-axis is on a log scale. (D) Density distribution of within-clade pairwise SNPs distance of clades 1 to 3. HPD, highest posterior density; SNP, single nucleotide polymorphism.

