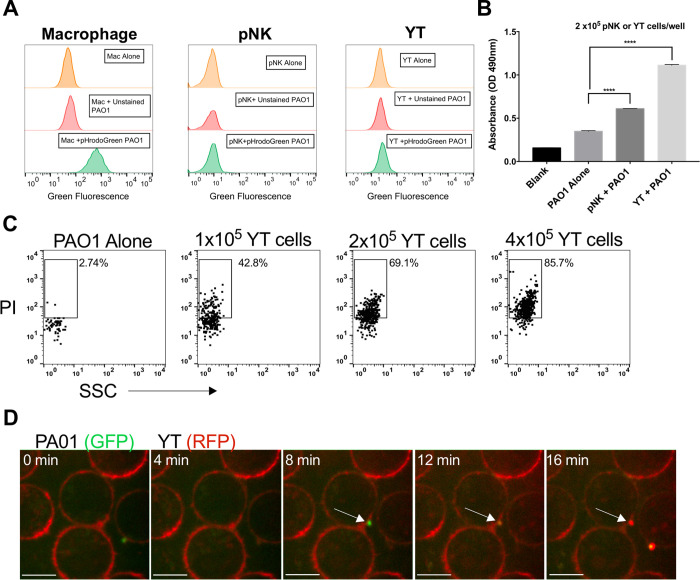
Fig 2. pNK and YT cells do not phagocytose P. aeruginosa PAO1, but they do directly induce membrane damage.
(A) Human macrophage, pNK or YT cells co-cultured with or without PAO1 at a 200:1 MOI for 1 hr. PAO1 was either unstained or stained with pHrodo Green AM dye to measure phagocytosis in the different cell types. A shift in green fluorescence as measured by the flow cytometer indicates phagocytosis of PAO1 by the cell type. Graph is representative of N = 2 biological replicates carried out on different days. Gating strategy in S4 Fig. (B) PAO1 incubated alone or in the presence of YT or human primary NK cells for 6 h followed by addition of 1mM nitrocefin for 12 h. (C) Representative flow cytometry plot of Propidium iodide (PI) staining of PAO1 that were either cultured alone or with YT cells for 2 h in culture media containing PI. (D) YT cells, expressing RFP actin, co-cultured with GFP PAO1. Membrane permeability was determined by the addition of PI to the media. Images were acquired every 15 seconds and representative images are shown at 2-minute intervals. Scale bar = 10μm. The video (Supplementary Video 1) is representative of at least 3 separate experiments. In all co-culture experiments, conditions were carried out in n = 4 wells (mean ± SEM) and the graph is representative of n ≥ 3 biological replicates performed on different days. * = P≤0.05, ** = P≤0.01, *** = P≤0.001. NS not significant.

