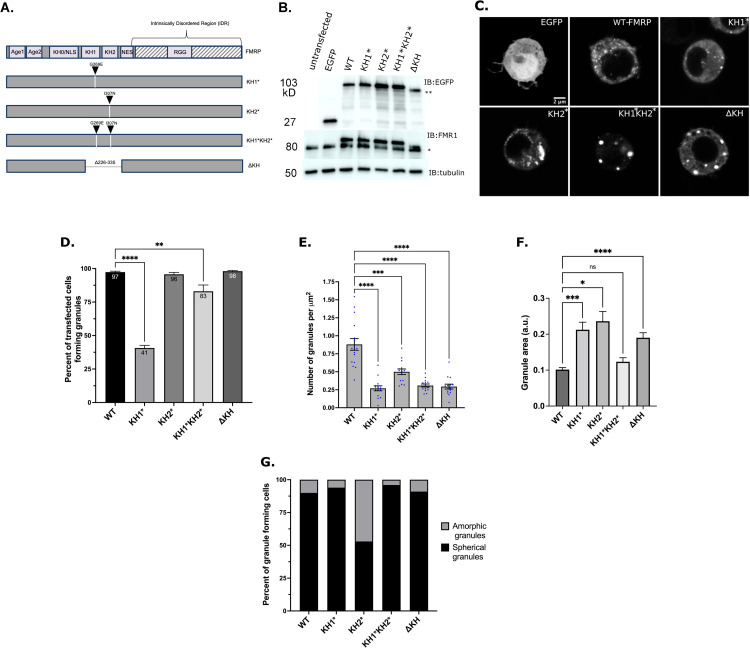
Fig 2. The KH domains differentially regulate FMRP granule formation.
(A) Schematic representation of dFMRP variants used in this study. Arrowheads indicate where analogous FXS-causing point mutations were made in dFMRP. Deletion of the KH1 and KH2 domains is annotated with a break in FMRP sequence. (B) Western blot analysis of EGFP (GFP), FMRP, and α-tubulin protein levels in transfected cells. α-tubulin was used as a loading control (* = 80 kDa, ** = 90 kDa). The upper bands on the FMR1 blot are the EGFP:FMRP fusion protein. (C) Representative images of cells transiently transfected with the indicated GFP-tagged FMRP constructs. Scale bar = 2 μm. (D) Percentage of transfected cells forming GFP-FMRP granules. Data are presented as mean ± S.E. (approximately 100 cells per three experiments; one-way ANOVA). (E) Quantification of the number of granules per cell, which was normalized to cell area in μm2 (mean ± SE; n = 15 cells each; Brown-Forsyth test). The data shown for the WT controls in Fig 2E are identical to those shown in Fig 1E. The cells analyzed are otherwise from an independent experiment. (F) Quantification of the relative size of granules (a.u.) in a new experiment (mean ± SE; Kruskal-Wallis test). Number of granules analyzed was WT = 209 (8 cells), KH1* = 85 (13 cells), KH2* = 127 (15 cells), KH1*KH2* = 110 (14 cells), ΔKH = 118 (15 cells). (G) Quantification of the two major morphological phenotypes observed (n = 100 cells each). In D-F, **p<0.01, ***p<0.001, ****p<0.0001.

