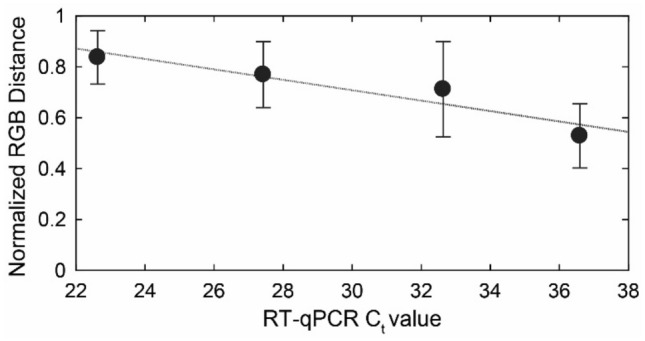
Figure 10.

Quantification of the pink-to-yellow/orange color change in the positive samples compared to the Negative Control, as a function of the RT-qPCR cycle threshold Ct. The quantification is performed by computing the color difference between the positive samples and the Negative Control, normalized to the difference between the Positive Control and Negative Control using the R, G, B linear dimensions defining the color space. The standard error bars represent the distribution of the normalized RGB distance for the samples categorized in four Ct bins of 0–25, 25–30, 30–35, and 35–40. (The figure is generated using MATLAB).
