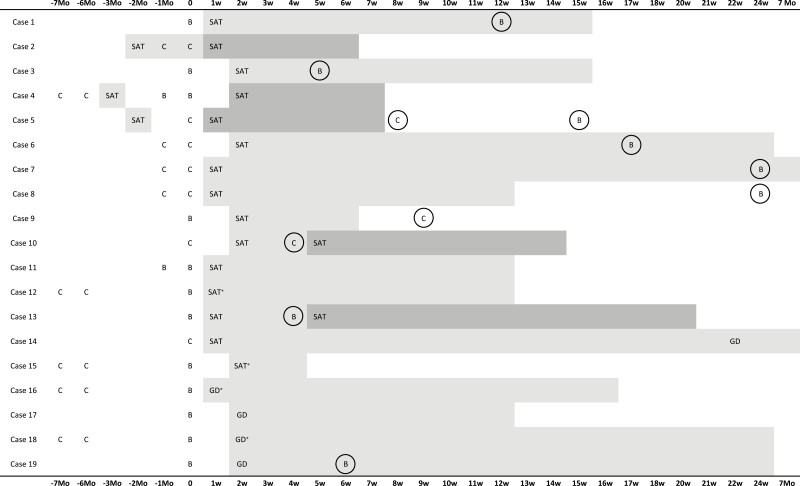
Figure 1.
SARS-CoV-2 vaccinations, as well as the onset and duration of disease in patients with SARS-CoV-2 vaccine–induced subacute thyroiditis (SAT) and Graves’ disease (GD), are illustrated in this timeline. SAT represents the onset of symptoms in patients with SAT, and GD represents the onset of symptoms in patients with GD. t0 illustrates the time of the administration of SARS-CoV-2 vaccination associated with thyroiditis. Mild gray indicates the time since remission or the follow-up period for patients who have not yet reached remission (*). Dark grey represents an exacerbation/recurrence in SAT. Repeat SARS-CoV-2 vaccinations that were received after SARS-CoV-2 vaccine–induced thyroiditis are circled. Abbreviations: B, BNT162b2; C, CoronaVac; Mo, month(s); w, week(s).

