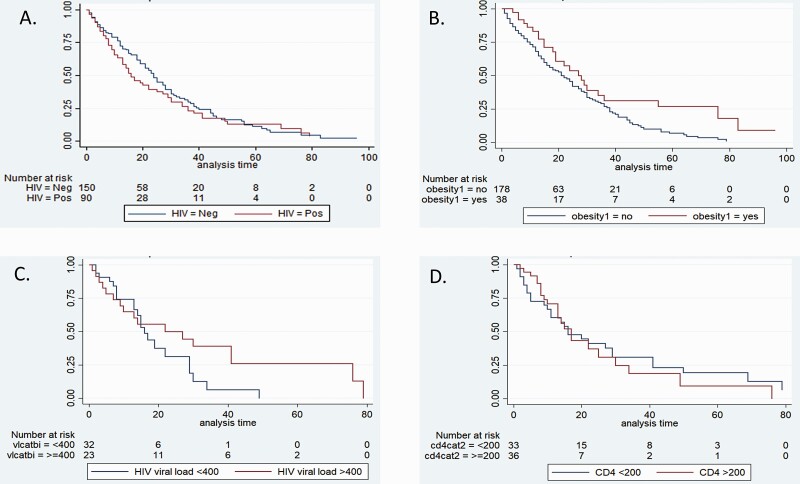
Figure 2.
Kaplan-Meier plots of proportion of SARS-CoV-2 shedding by days following symptom onset by (A) HIV status, (B) presence of obesity (BMI > 30), (C) HIV viral load among PLHIV, and (D). CD4 T-lymphocyte count among persons living with HIV (PLHIV). Abbreviations: BMI, body mass index; HIV, human immunodeficiency virus; SARS-CoV-2, severe acute respiratory syndrome coronavirus 2.

