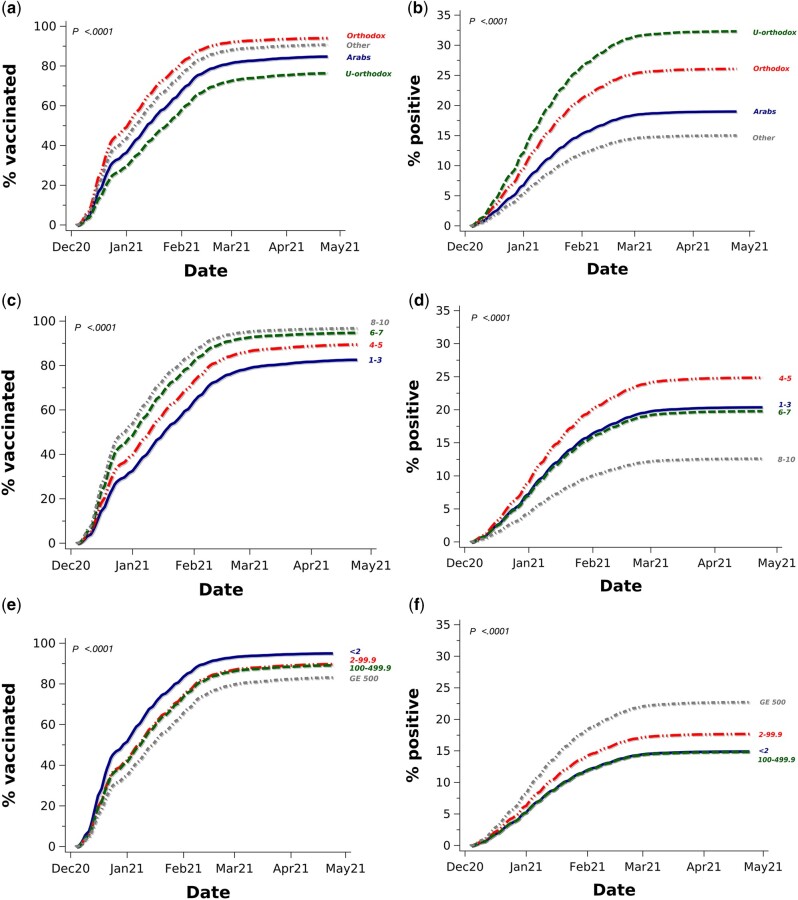
Figure 2.
Age-adjusted cumulative vaccination incidence and age-adjusted competing SARS-CoV-2 infection rates by population group [(a), (b), respectively], socioeconomic status [(c), (d)] and locality population size in thousands [(e), (f)] in those aged 60–64 years. GE denotes greater than or equal to. Percentages (%) of vaccinated refer to cumulative incidence/100 accounting for the competing COVID-19 infection risk. % positive refers to cumulative SARS-CoV-2 infection rate/100 based on Kaplan-Meir infection-free survival. Results are presented for the 60–64 age slice for comparability.

