
Fig. 2.
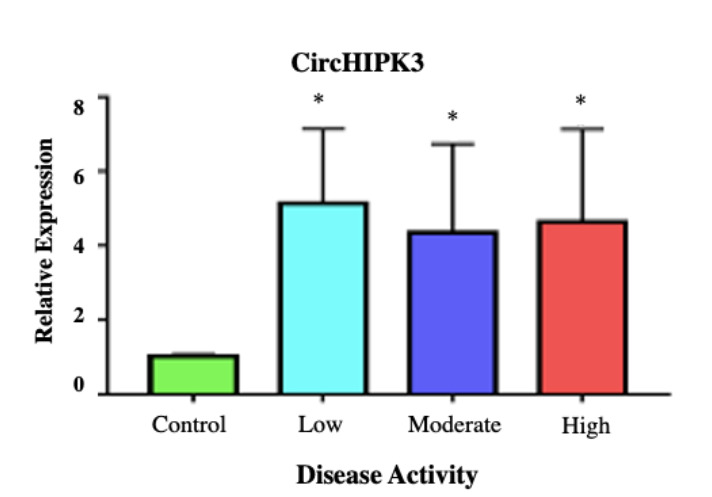
Mean±SD of the fold change of CircHIPK3 RNA expression among the studied groups. *denotes highly significant difference versus the control group (P-value< 0.001).
Official websites use .gov
A
.gov website belongs to an official
government organization in the United States.
Secure .gov websites use HTTPS
A lock (
) or https:// means you've safely
connected to the .gov website. Share sensitive
information only on official, secure websites.
Mean±SD of the fold change of CircHIPK3 RNA expression among the studied groups. *denotes highly significant difference versus the control group (P-value< 0.001).