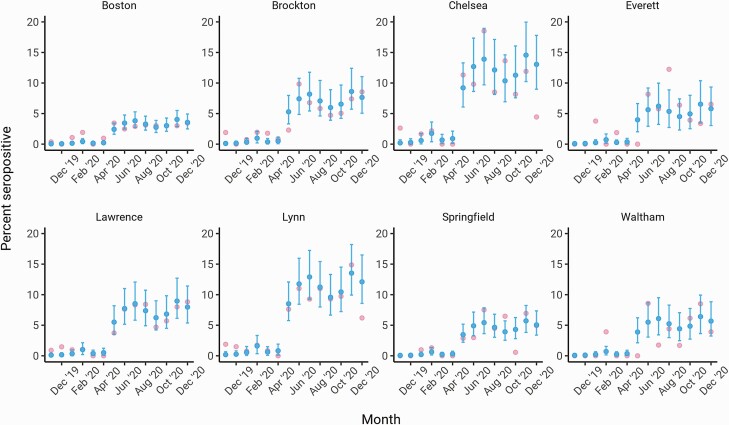
Figure 3.
Longitudinal seroprevalence trends in cities and towns from November 2019 to December 2020 estimated using the monthly multilevel regression and poststratification model adjusting for test specificity. The 8 cities and towns with the highest lower 90% credible interval in December 2020 and at least 20 heel stick samples collected are shown. The mean seroprevalence estimates are indicated by the blue dots (dark gray in grayscale) with the error bars depicting the 90% credible intervals; pink dots (light gray in grayscale) represent unadjusted monthly seroprevalence estimates.

