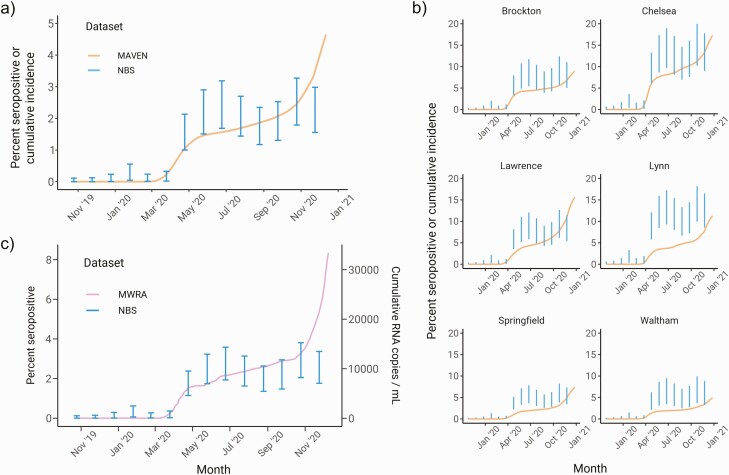
Figure 4.
Comparison of multilevel regression and poststratification seroprevalence estimates with severe acute respiratory syndrome coronavirus 2 (SARS-CoV-2) surveillance data from reported cases and wastewater testing. a, Statewide longitudinal seroprevalence trend estimated from newborn screening samples (vertical bars) overlaid with cumulative incidence from MAVEN epidemiological surveillance data (smoothed line). b, Seroprevalence trends for 6 cities and towns (blue) overlaid with MAVEN cumulative incidence (smoothed line). c, Seroprevalence trend for the northern MWRA region (vertical bar) vs cumulative RNA copies per milliliter from wastewater SARS-CoV-2 testing for the same region (smoothed line). In all subpanels, the blue error bars depict the 90% credible interval for seroprevalence, and seroprevalence data are shifted backward by 3 weeks to match the timing of surveillance data. Abbreviations: MAVEN, Massachusetts Virtual Epidemiologic Network; MWRA, Massachusetts Water Resource Authority; NBS, newborn screening.

