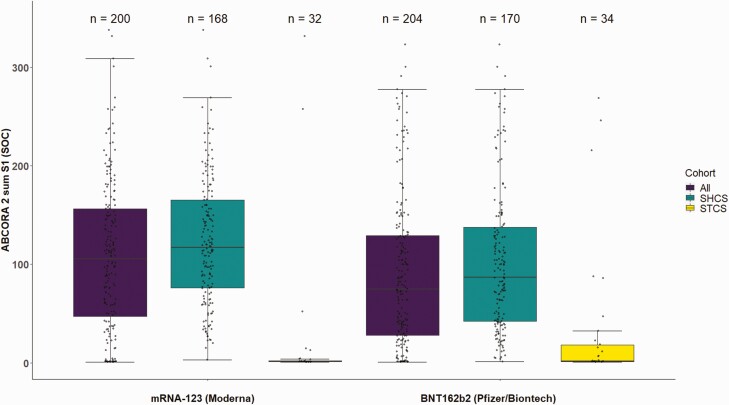
Figure 2.
Antibody response in immunocompromised patients after receiving 2 doses of SARS-CoV-2 vaccines (per-protocol data set) using ABCORA 2 [15].
Figure shows combined reactivity of IgM, IgA, and IgG to the subunit S1 in patients who received the allocation they were randomized to and provided a blood sample at follow-up (per-protocol). Depicted are sum S1 (sum of S1 signal over cutoff values IgG, IgA, IgM) off all patients, patients from Swiss HIV Cohort Study (SHCS), Swiss Transplant Cohort Study (STCS). Box plots indicate the interquartile ranges with vertical lines representing the minimum and maximum values. ABCORA 2, Antibody Coronavirus Assay 2; Ig, immunoglobulin; SARS-CoV-2, severe acute respiratory syndrome coronavirus 2.

