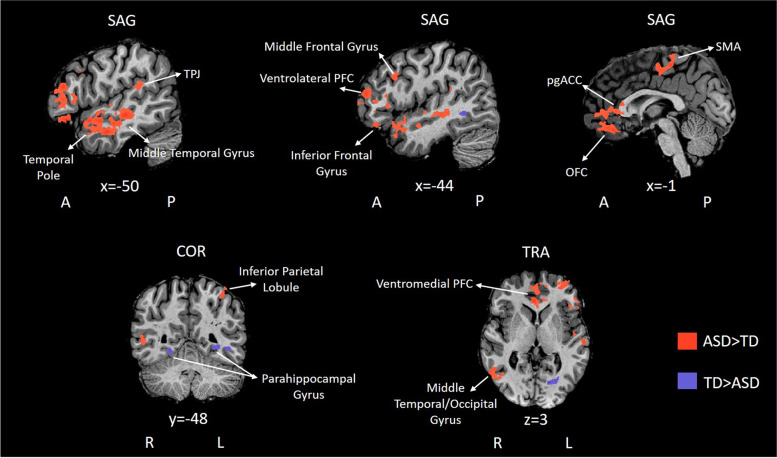
Fig. 3.
RFX ANOVA group effects for EcoSupermarketX task. Statistical maps from group analysis overlaid on sagittal, coronal, and transversal slices of a representative subject. Red clusters depict regions where BOLD activity was higher for individuals with ASD than TD. Blue clusters depict regions where BOLD activity was lower for individuals with ASD than TD. Slice locations are given in MNI coordinates. NOTE. ASD, autism spectrum disorder group, TD, typical neurodevelopment group, TPJ, temporal-parietal junction, PFC, prefrontal cortex, pgACC, pregenual anterior cingulate cortex; OFC, orbitofrontal cortex, SMA, supplementary motor area, A, anterior; P, posterior, R, right, L, left; SAG, sagittal plane; COR, coronal plane; TRA, transversal plane; MNI, Montreal Neurological Institute

