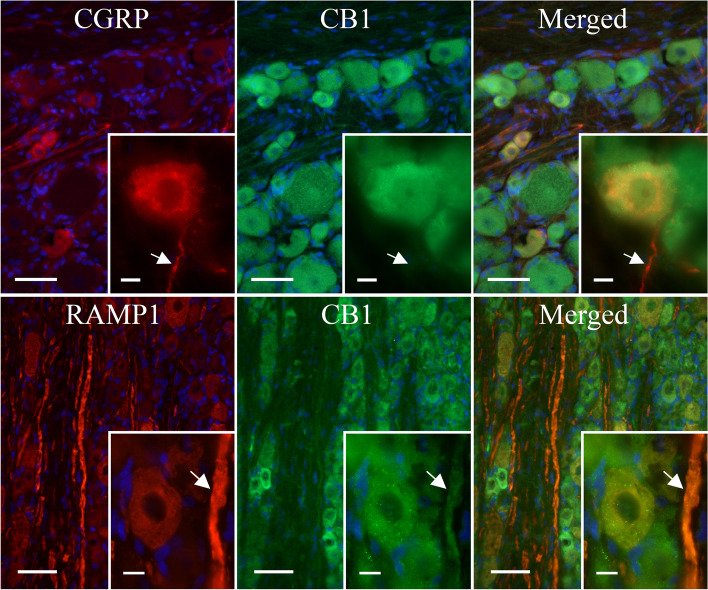
Fig. 4.
The expression of CB1, CGRP and RAMP1 in the TG. IHC localization of CB1, CGRP and the functional CGRP receptor (by staining for RAMP1) in the TG. Blue represents cell nuclei; orange represents colocalization of CGRP (upper panel) or RAMP1 (lower panel) with CB1; globular regions represent neuronal somas and fibrous regions represent individual neuronal fibres. Large image scale corresponds to 50 mm, and the insert scale corresponds to 10 μm. The arrows mark unmyelinated C-fibres (upper panel) and myelinated Aδ-fibres (lower panel)

