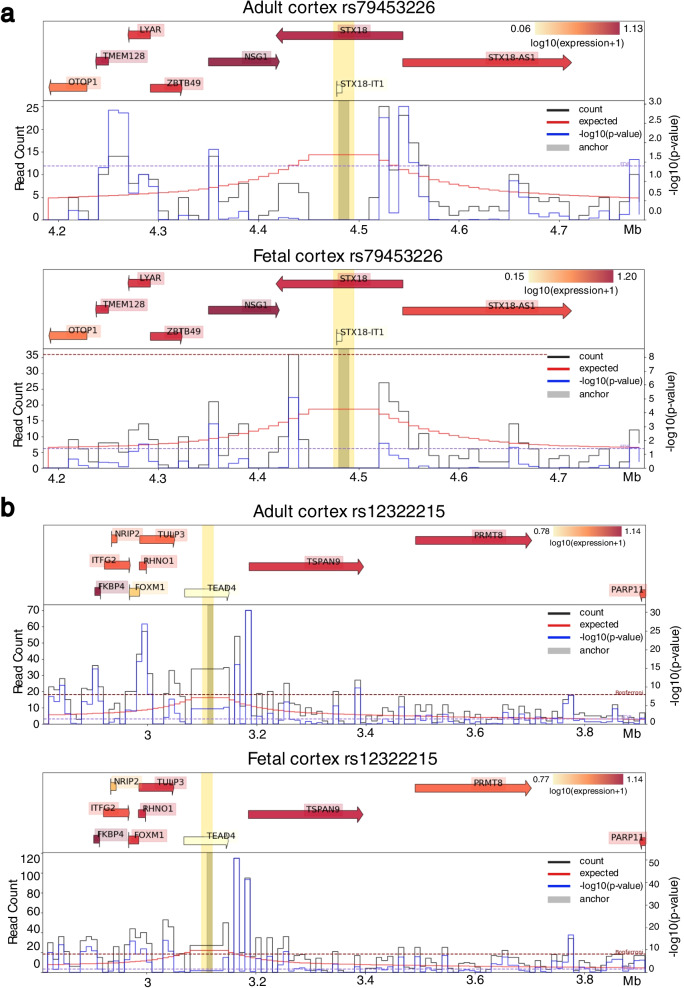
Fig. 4.
Virtual 4C plots. Centered at a rs79453226 b rs12322215 in adult cortex and fetal cortex. The bin containing the anchor position is indicated as a thick grey vertical bar. Different genes or regions can be highlighted in yellow. On the top is gene expression data with gene locations. Each gene is indicated by an arrow pointing the direction of transcription. The start site is indicated by the tail of the arrow. Each gene is labeled by its common name and highlighted in red indicating the expression level: the deeper the red color the higher the expression. On the bottom is the chromatin interaction Hi-C data that is plotted as a virtual 4C plot with the given anchor position. The black line shows the observed counts, the red line shows the expected counts, and the blue line shows the -log10(p value). The range of the -log10(p value) is plotted on the y-axis on the right while the range of the count data is shown on the left. The x-axis is the genomic location in Mb. NCBI build 37

