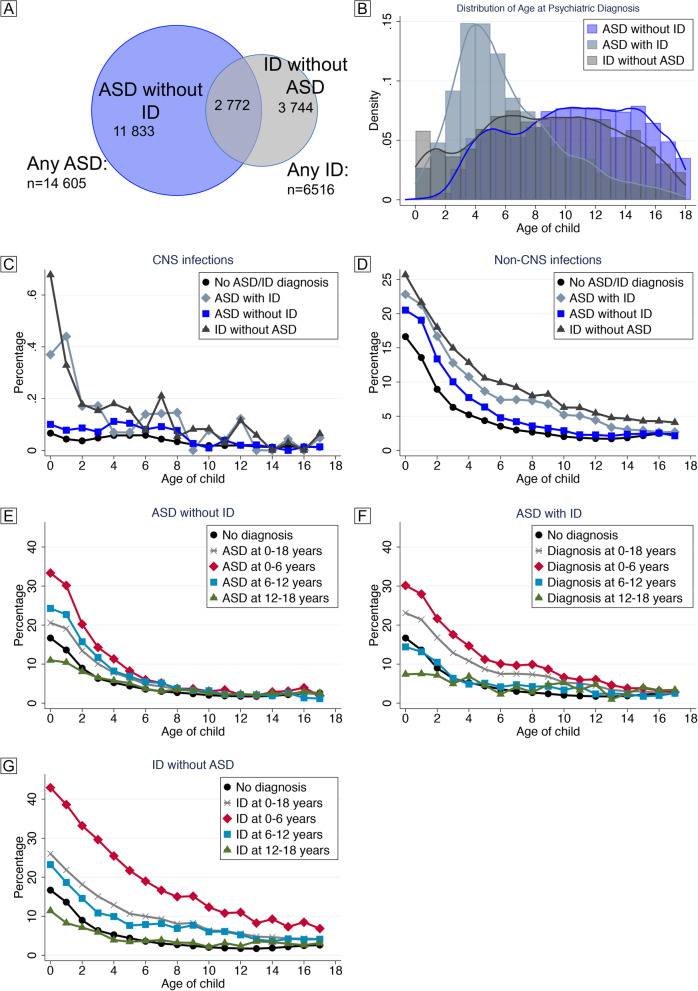
Fig. 1.
Description of outcomes and exposures in the study population. Individuals diagnosed with ASD and/or ID identified in the final study population (n=556,732) as of December 31, 2016 (A). Age at first diagnosis of ASD/ID for the mutually exclusive diagnostic groups (B). Incidence of CNS (C) and non-CNS infections (D) according to age among children unaffected by ASD/ID and among those diagnosed with “ASD without ID,” “ASD with ID,” “ID without ASD.” Note the different scales of the y-axes in C and D. Incidence of one or more infections according to age among children unaffected by ASD/ID and those diagnosed with “ASD without ID” (E), “ASD with ID” (F), and “ID without ASD” (G), throughout childhood and stratified by age at diagnosis of ASD/ID

