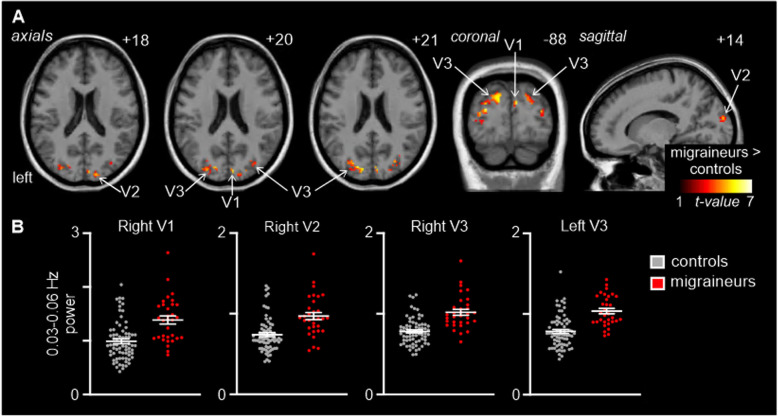
Fig. 1.
A. Significantly higher resting infra-slow (0.03–0.06 Hz) power in migraineurs (n = 32) compared with controls (n = 71) in the occipital lobe (random effects, p < 0.05, corrected). Significant clusters are overlaid onto a mean T1-weighted anatomical image and the location of each axial, coronal and sagittal slice in Montreal Neurological Institute space indicated at the top right of each slice. B. Plots of individual subject and mean (± standard error of mean) power in four significant clusters. V1: primary visual cortex; V2: secondary visual cortex; V3: third visual complex

