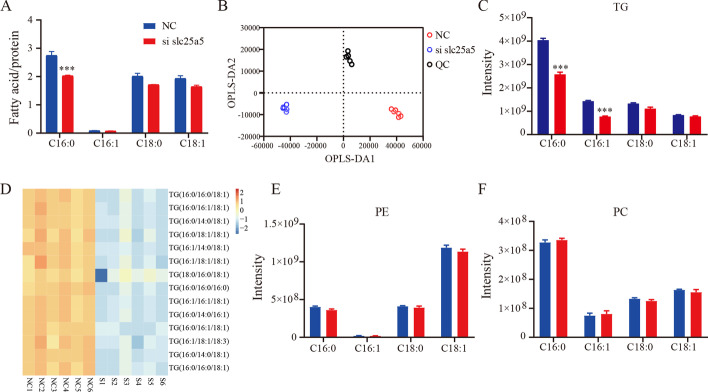
Fig. 3.
Slc25a5 silencing decreases the content of cellular fatty acids. A Cellular fatty acids were identified by GC–MS after adipogenic differentiation. B OPLS-DA score plot showing clear clustering between the NC and Slc25a5-silenced groups. C The composition of TGs (C16:0, C16:1, C18:0, and C18:1) among lipids. D The differential lipid composition of TGs was determined by VIP scores (VIP > 2, P < 0.05). E, F The proportion of PE and PC (C16:0, C16:1, C18:0, and C18:1) among lipids. The values are the mean ± SEM (n = 6). ***P < 0.001 versus control

