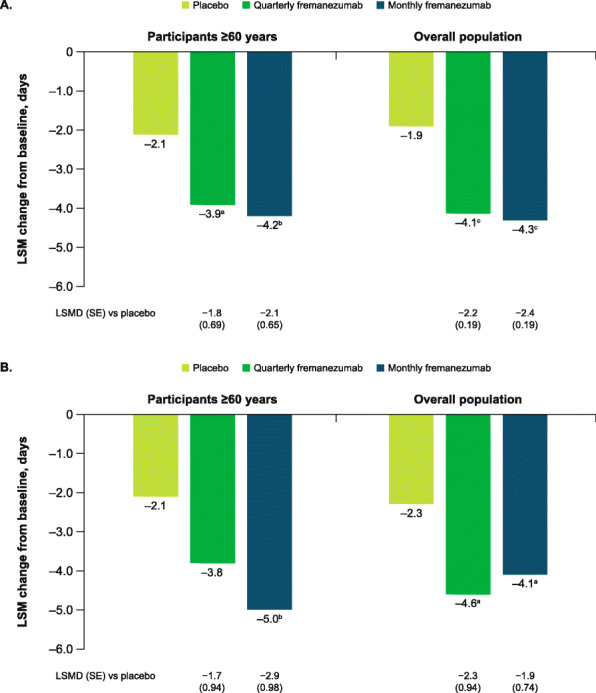
Fig. 3.

Change in monthly headache days during 12 weeks A) overall and B) by migraine classification. LSM, least-squares mean; LSMD, least-squares mean difference; SE, standard error. Data shown are the LSM changes from baseline in the monthly average number of headache days of at least moderate severity during 12 weeks of double-blind treatment. Part A includes data for participants ≥60 years and the overall pooled population; part B includes data for participants ≥60 years by migraine diagnosis (chronic or episodic migraine). aP < 0.05 vs placebo. bP < 0.005 vs placebo. cP < 0.0001 vs placebo
