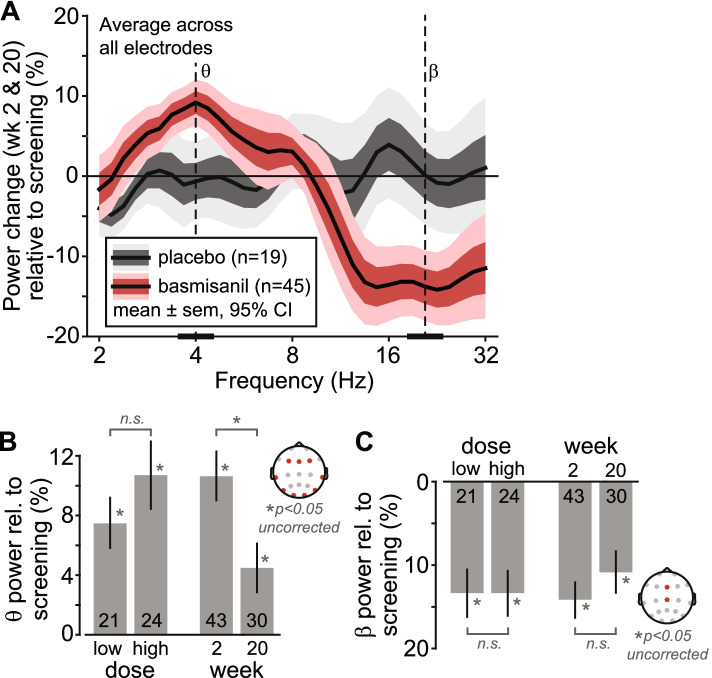
Fig. 3.
Quantitative EEG. A Change in EEG spectral power (average across week 2 and week 20 visits relative to baseline) for dosed (red) and the placebo (gray) groups. B, C Effects of assessment time-point (week 2 vs. week 20) and dose (low dose vs. high dose) for signal power extracted from the centers of the clusters identified in 1.2.3 (theta cluster, frequency range [3 bins]: ~ 3.5–4.5 Hz, electrodes: F3, Fz, F4, T7, T8, P7, P8, O1, O2; beta cluster, frequency range [3 bins]: ~ 19–22.5 Hz, electrodes: Fz, Cz). The top plots indicate the electrodes used for each extraction of signal power. The numbers at the base of the bars indicate the number of participants entering the analyses

