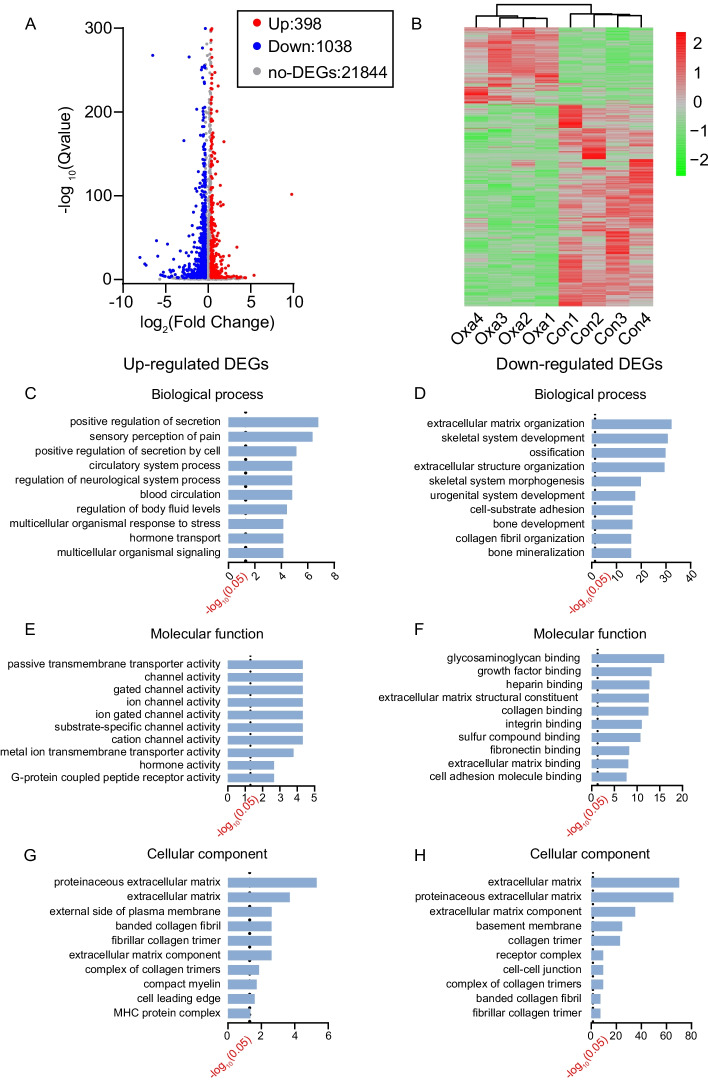
Fig. 2.
Bioinformatics analysis of DRG from oxazolone-induced mouse ACD model. A Volcano graph of mRNA expression in DRG of oxazolone (Oxa) group versus control (Con) group. Dots with different colors indicate corresponding expression changes. B Heatmap illustration of the hierarchical clustering of DEmRNAs of oxazolone group versus control group. C, E, and G The top ten most significantly enriched biological processes, molecular functions, and cellular components of upregulated DEmRNAs. D, F, and H The top ten most significantly enriched biological processes, molecular functions, and cellular components of downregulated DEmRNAs. The dotted line indicates q-value of 0.05

