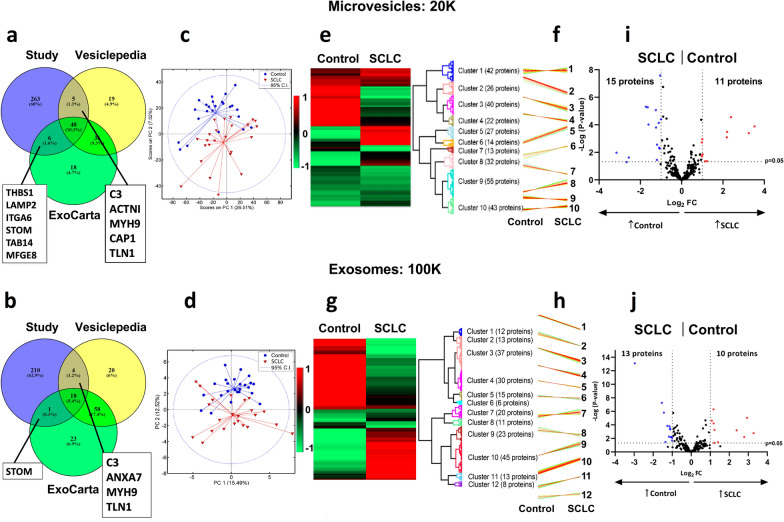
Fig. 2.
Proteomic analysis of circulating microvesicles and exosomes. a For the MV samples, a total of 51 proteins overlapped with the top 100 proteins from at least one of the EV databases, Vesiclepedia and ExoCarta (Additional file 2: Table S1) with 40 proteins common to all three groups and six and five proteins being shared between the study and ExoCarta and Vesiclepedia, respectively. b Of the 233 identified proteins in exosomes, 23 overlap with the top 100 EVs from at least one of the EV databases, of which 18 proteins were common to all three groups and one and four proteins are shared between the study and ExoCarta and Vesiclepedia, respectively. PCA revealed a clear separation between Controls (blue circles) and SCLC patients (Baseline, red triangles) along the second principal component for 20 K (c) and 100 K (d). Hierarchical clustering analysis revealed 10 distinct protein clusters, a heatmap (e) and their respective profile plots (f) for the MV samples, and 12 distinct protein clusters, a heatmap (g) and profile plots (h) for the exosome samples. The heatmaps depict LFQ-values normalized to Z-score, while the profile plots depict the expression patterns of proteins clustered in each cluster. To investigate potential diagnostic markers for both EV-samples, volcano plots depicting upregulated proteins for SCLC (red) versus controls (blue) were prepared according to fold change (Log2 FC ≥ 1 or ≤ − 1) and p-value = 0.05 (grey dotted lines). i For the 20 K sample, 11 proteins were significantly upregulated in the SCLC and 15 proteins in the control group. j For the 100 K sample, 10 proteins were significantly upregulated in the SCLC and 13 proteins in the control group. SCLC small cell lung cancer, MV microvesicle, EVs extracellular vesicles, PCA principle component analysis, PC principal component, CI confidence interval, LFQ label-free quantification, FC fold change

