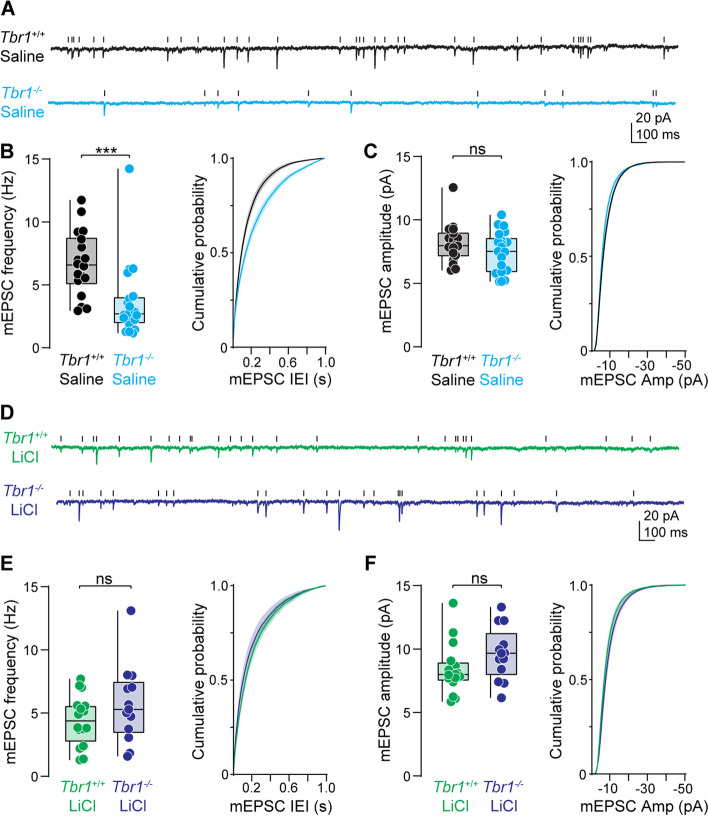
Fig. 3.
A single LiCl treatment restores excitatory synapse function in Tbr1layer5 CKOs. A Representative traces of miniature excitatory postsynaptic currents (mEPSCs) from saline treated (4 ml/kg) P65-106 Tbr1wildtype (black) and Tbr1layer5CKO (cyan) layer 5 thick-tufted pyramidal neurons in the medial prefrontal cortex (mPFCx). Scale bars: 20 pA, 100 ms. B Left: quantification of mEPSC frequency. Mann-Whitney ***p = 0.0001 (Tbr1wildtype+saline: 6.71 ± 0.6 Hz, n = 18, Tbr1layer5CKO+saline 3.627 ± 0.7 Hz, n = 20). Right: cumulative probability distribution of mEPSC inter-event intervals. Kolmogorov-Smirnov **p = 0.002. C Left: quantification of mEPSC amplitude. Mann-Whitney p = 0.32 (Tbr1wildtype: 6.03 ± 0.4 pA, n = 18, Tbr1layer5CKO 5.15 ± 0.4 pA, n = 20). Right: cumulative probability distribution of mEPSC amplitude. Kolmogorov-Smirnov p = 1.0. D Representative traces of mEPSCs from layer 5 neurons of P95-104 Tbr1wildtype (green) and Tbr1layer5CKO (purple) treated with 400 mg/kg LiCl at P30. Scale bars: 20 pA, 100 ms. E Left: quantification of mEPSC frequency. Mann-Whitney p = 0.31 (Tbr1wildtype+ LiCl: 4.43 ± 0.5 Hz, n = 16, Tbr1layer5CKO+ LiCl: 5.69 ± 0.9 Hz, n = 13). Right: cumulative probability distribution of mEPSC inter-event intervals. Kolmogorov-Smirnov p > 0.99. F Left: quantification of mEPSC amplitude. Mann-Whitney p = 0.09 (Tbr1wildtype+ LiCl: 8.41 ± 0.5 pA, n = 16, Tbr1layer5CKO+ LiCl 9.63 ± 0.6 pA, n = 13). Right: cumulative probability distribution of mEPSC inter-event intervals. Kolmogorov-Smirnov p > 0.99. Boxplots are min to max show all points

