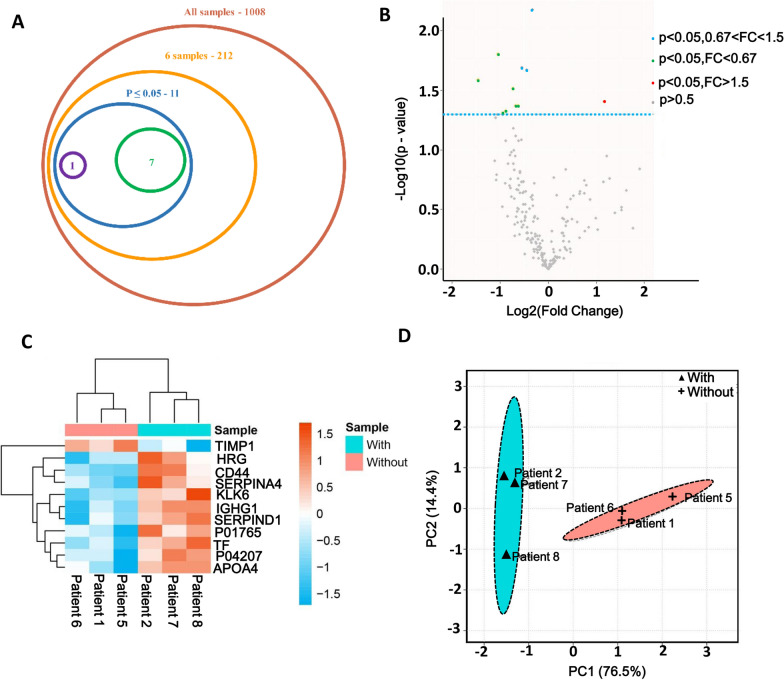
Fig. 1.
Identified DEPs between non-CH (n = 3) and CH (n = 3). A Number of proteins identified. A total of 1008 proteins were identified from six samples; After decontamination, 212 proteins had quantitative information in six samples. Only 11 proteins were defined as DEPs, reaching P < 0.05. Among them, 10 proteins were upregulated and one protein was downregulated in the CH group, compared with the non-CH group. B Volcano plot of DEPs. C Heatmap for significantly DEPs. The full name of the DEPs can be found in Additional file 7: Table S5. D: PCA plots of 11 DEPs between non-CH and CH. “With” indicates patients with CH and “without” indicates patients without CH

