Figure 6.
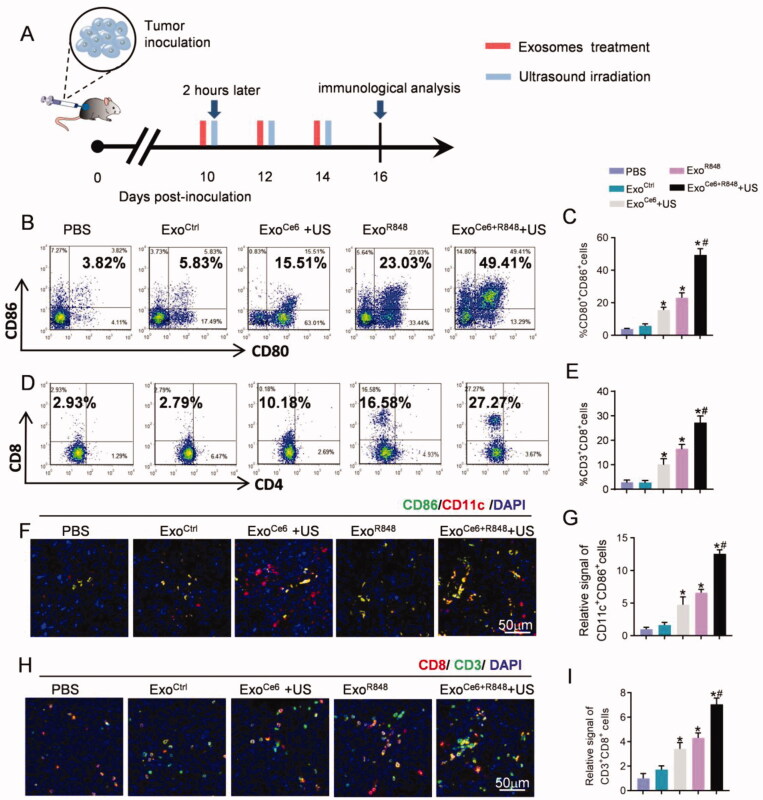
Exosomes in each treatment group for activating DCs and anti-tumor T-cell immune response by flow cytometric analysis and immunofluorescence. (A) Schematic diagram of the experimental procedure. Exosomes (109 particles/mL) were injected three times at an interval of two days, and their dose was 2 × 10⁹ particles/kg body weight per injection. Insonation (1 MHz, 2.0 W cm−2, 20% duty cycle, 5 min) was applied two hours after administration. Tumors were excised for immunological analysis on day 16 after inoculation RM-1 cells. Flow cytometric analysis of (B) proportion of mature DCs (CD80+CD86+) over CD11c+ DCs and (D) CD8+ T cells over CD3+ T cells at the tumor tissues with different treatments. (C, E) Statistical results of (B) and (D), respectively (n = 5). (F) Immunofluorescence staining of CD11c+ CD86+ in tumor sections after different treatments. (H) Immunofluorescence staining of CD3+ CD8+ in tumor sections after different treatments. (G, I) Statistical results of (F) and (H), respectively (n = 5). Data are expressed as mean ± SEM, one-way ANOVA, *p<.05, ExoCe6+US, ExoR848, ExoCe6+R848+US versus ExoCtrl; #p<.05, ExoCe6+R848+US versus ExoR848.

