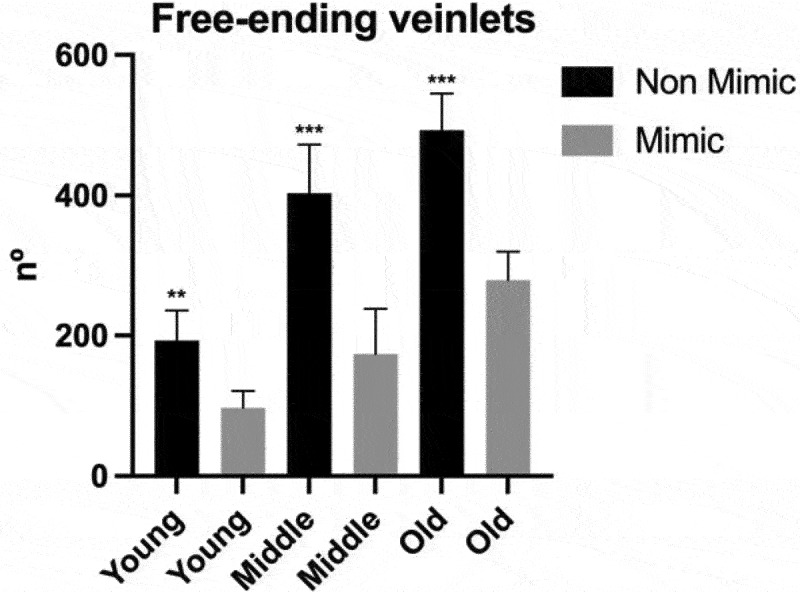
Figure 7.

Quantification of the free-ending veinlets. Number of free-ending veinlets per leaf. Black bars correspond to non-mimic leaves (control), without contact with plastic leave. Gray bars correspond to mimic leaves, with close contact with plastic leaves. Leaves were classify into young, middle and old regarding their age. Measurements performed in 4 biological repetitions and two-tailed Student’s t-test was used to identify significant differences between mimick and non-mimic leaves. P-values<0.05 were considered significant (***P < .001; **P < .01; *P < .05). The error bars reported in all graphs represent standard deviation.
