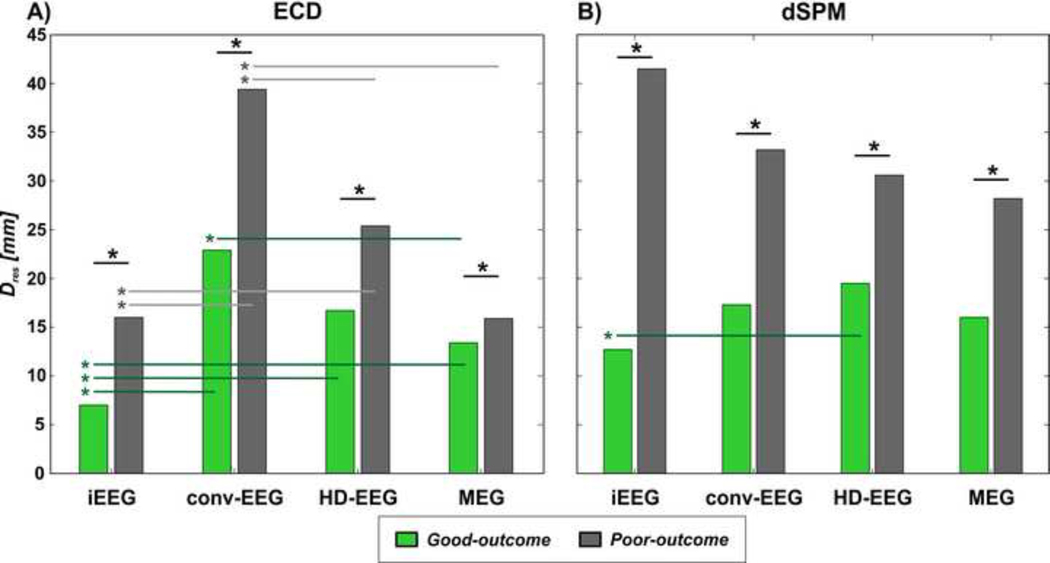
Figure 6. Distance of IZ (dipoles and dSPM) from the resection (Dres) in patients with good vs. poor outcome.
IZ is localized using ECD in (A) and dSPM in (B). For each modality, the mean Dres (in mm) of the IZ localized in patients with good outcome (green bars) is shown against the mean Dres of the IZ localized in patients with poor outcome (grey bars). Significant differences (p-value<0.05) between distances are indicated with straight lines and an asterisk (*).

