. 2022 Mar 2;11:e72468. doi: 10.7554/eLife.72468

Figure 6. NBI-921352 is more potent than three commonly prescribed NaV inhibitor ASMs.

Brain concentration versus fraction of animals exhibiting is plotted for NBI-921352 versus that for phenytoin, carbamazepine, and lacosamide in the Scn8aN1768D+/- modified 6 Hz model (A), the wild-type mouse DC-MES model (B), and the wild-type rat DC-MES model (C). Each point represents the fraction of animals exhibiting a GTC with hindlimb extension after stimulus from a dosing group of six to eight animals. Horizontal error bars show the standard error of the mean brain concentrations measured from the animals in that dosing group immediately after assay. Where error bars are not visible, they are smaller than the symbols. Statistical analysis of significance of the dose groups for the concentrations shown were performed as in Figure 5 and can be found in Figure 5—figure supplement 1 (NBI-921352), Figure 6—figure supplement 1 (Carbamazepine), Figure 6—figure supplement 2 (Phenytoin), and Figure 6—figure supplement 3 (Lacosamide).

Figure 6—source data 1. Quantification of effective brain concentrations of NBI-921352 versus common AEDs.

Figure 6.

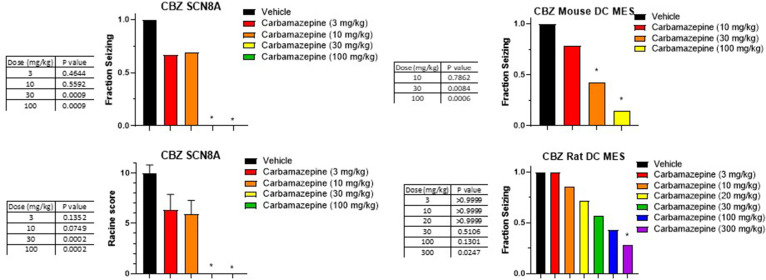
Figure 6—figure supplement 1. Dose response and statistical analysis of the Carbamazepine dose groups for which brain and plasma concentration response curves are shown in Figures 6 and 7 respectively.

Figure 6—figure supplement 1.

In some cases, multiple experimental groups at the same test dose were assessed. In such cases, groups at the same dose level were combined here for comparison to vehicle treated animals. Fraction seizing data is expressed as a mean of the binary seizure score for all tested animals, where animals that seized received a score of 1 and animals that did not seize received a score of 0. In the SCN8A 6 Hz assay two endpoints were noted cumulative Racine score, and presence of a tonic clonic seizure with hind-limb extension. Both scores are presented. Racine score data (bottom left) is expressed as a mean ± SEM. A cumulative Racine score evaluation was performed at the same time as the fraction seizing evaluation and provided qualitatively similar results. While not reported in the results section we show those values here for comparison. For details, see Focken et al., 2019. Identification of CNS-Penetrant Aryl Sulfonamides as Isoform-Selective NaV1.6 Inhibitors with Efficacy in Mouse Models of Epilepsy. (J) Med Chem, 62(21), 9618–9641. Between-group differences were analyzed using a Kruskal-Wallis test followed by Dunn’s multiple comparisons test (fraction seizing data) or ordinary one-way ANOVA followed by Dunnett’s multiple comparison test (Racine score data). A statistically significant difference relative to vehicle treated groups is indicated by a star and was reached at values of p < 0.05 (compared to vehicle treated animals). p Values for each comparison to vehicle are shown in the figure.
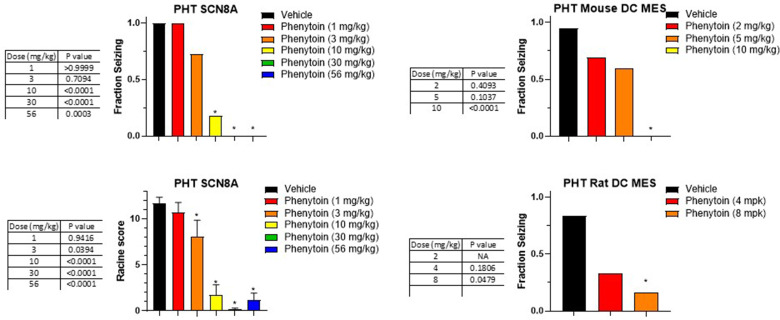
Figure 6—figure supplement 2. Dose response and statistical analysis of the Phenytoin dose groups for which brain and plasma concentration response curves are shown in Figures 6 and 7 respectively.

Figure 6—figure supplement 2.

In some cases, multiple experimental groups at the same test dose were assessed. In such cases groups at the same dose level were combined here for comparison to vehicle treated animals. Fraction seizing data is expressed as a mean of the binary seizure score for all tested animals, where animals that seized received a score of 1 and animals that did not seize received a score of 0. In the SCN8A 6 Hz assay two endpoints were noted cumulative Racine score, and presence of a tonic clonic seizure with hind-limb extension. Both scores are presented. Racine score data (bottom left) is expressed as a mean ± SEM. A cumulative racine score evaluation was performed at the same time as the fraction seizing evaluation and provided qualitatively similar results. While not reported in the results section we show those values here for comparison. For details see Focken et al., 2019. Identification of CNS-Penetrant Aryl Sulfonamides as Isoform-Selective NaV1.6 Inhibitors with Efficacy in Mouse Models of Epilepsy. (J) Med Chem, 62(21), 9618–9641. Between-group differences were analyzed using a Kruskal-Wallis test followed by Dunn’s multiple comparisons test (fraction seizing data) or ordinary one-way ANOVA followed by Dunnett’s multiple comparison test (Racine score data). A statistically significant difference relative to vehicle-treated groups is indicated by a star and was reached at values of p < 0.05 (compared to vehicle treated animals). p Values for each comparison to vehicle are shown in the figure.
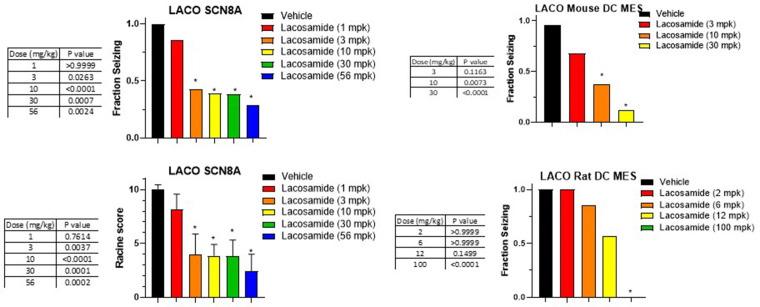
Figure 6—figure supplement 3. Dose response and statistical analysis of the Lacosamide dose groups for which brain and plasma concentration response curves are shown in Figures 6 and 7 respectively.

Figure 6—figure supplement 3.

In some cases, multiple experimental groups at the same test dose were assessed. In such cases groups at the same dose level were combined here for comparison to vehicle-treated animals. Fraction seizing data is expressed as a mean of the binary seizure score for all tested animals, where animals that seized received a score of 1 and animals that did not seize received a score of 0. In the SCN8A 6 Hz assay two endpoints were noted cumulative Racine score, and presence of a tonic clonic seizure with hind-limb extension. Both scores are presented. Racine score data (bottom left) is expressed as a mean ± SEM. A cumulative racine score evaluation was performed at the same time as the fraction seizing evaluation and provided qualitatively similar results. While not reported in the results section we show those values here for comparison. For details see Focken et al., 2019. Identification of CNS-Penetrant Aryl Sulfonamides as Isoform-Selective NaV1.6 Inhibitors with Efficacy in Mouse Models of Epilepsy. (J) Med Chem, 62(21), 9618–9641. Between-group differences were analyzed using a Kruskal-Wallis test followed by Dunn’s multiple comparisons test (fraction seizing data) or ordinary one-way ANOVA followed by Dunnett’s multiple comparison test (Racine score data). A statistically significant difference relative to vehicle treated groups is indicated by a star and was reached at values of p < 0.05 (compared to vehicle-treated animals). p Values for each comparison to vehicle are shown in the figure.