. 2022 Mar 8;11:e71094. doi: 10.7554/eLife.71094

Figure 4. RNA-seq-derived gene signatures of human placental samples following 8 hr 25(OH)D3 incubation.

(a) Principal component analysis indicated clustering of 25(OH)D3-treated samples (clear) compared with control samples (black). (b) Volcano plot showing 493 genes were differentially expressed (red) at a false discovery rate (FDR)-adjusted p-value<0.05 (gray line). (c) Differentially expressed genes with a fold change of 1.5 or above at FDR 0.05 are presented as heatmaps [log2(normalized expression)]. (d) Pathway analysis (ToppGene) of all differentially expressed genes (no fold change cutoff) reveals both up- and downregulation of molecular function and biological process gene pathways following 8 hr 25(OH)D3 incubation. For pathway analysis, significance was adjusted using the Benjamini–Hochberg correction depicted by –log(B&H q-value) with a significance threshold of 1% (dashed line).

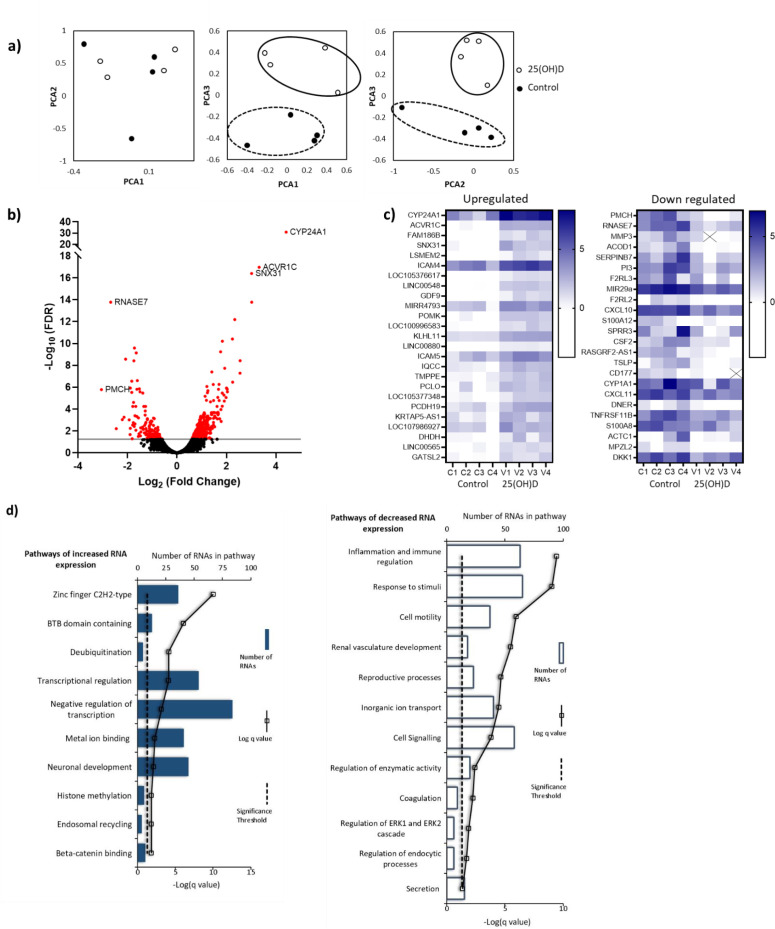
Figure 4.

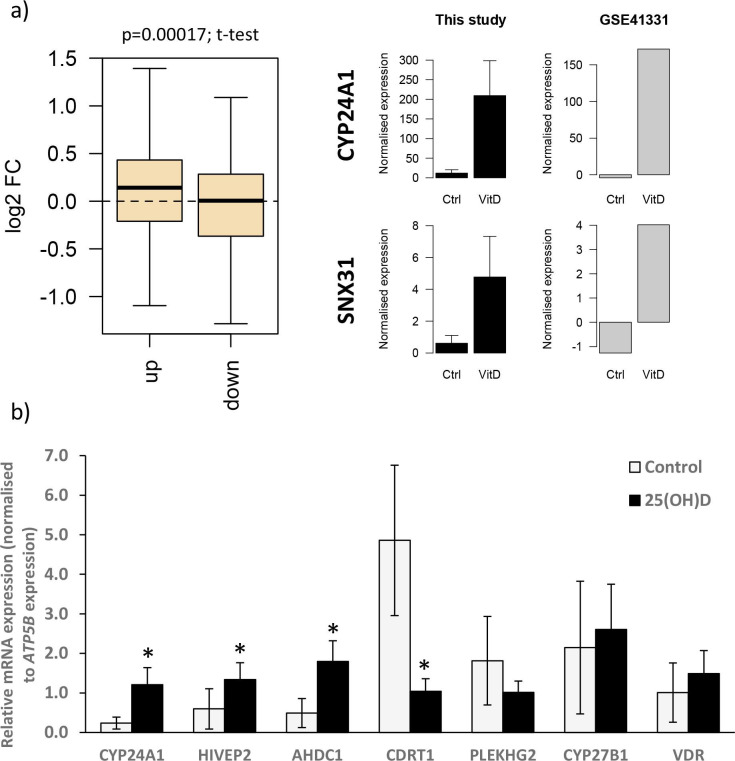
Figure 4—figure supplement 1. Gene expression changes following vitamin D incubation.

Figure 4—figure supplement 1.

(a) Gene expression changes observed in this study following 8 hr 25(OH)D3 exposure were compared with those in a published dataset from human placenta (GSE41331), which looked at longer-term vitamin D response (24 hr). Genes that were upregulated following 8 hr exposure also tended to have increased expression in the 24 hr dataset, whereas downregulated genes were unchanged. Differentially expressed genes in common between both placental datasets included CYP24A1 and SNX31. (b) Relative mRNA expression levels for selected genes that in the RNA-seq dataset had increased (CYP24A1, HIVEP2, AHDC1), decreased (CDRT1, PLEKHG2), or unaltered (CYP27B1, VDR) expression levels following 8 hr 25(OH)D3 incubation (*p<0.05). Data are presented as mean (SD).