. 2022 Feb 25;11:e72834. doi: 10.7554/eLife.72834

Figure 3. Molecular dissection of element C and the identification of direct transcriptional inputs.

(A) Summary of transgenic GFP expression regulated by element C truncations using reporter constructs. Serial truncation of element C was performed based on boundaries of peaks defined by chromatin accessibility, Sp-Alx1-binding, and enhancer RNA (eRNA) expression. (B) Summary of GFP expression driven by C.ChIP element mutants. Criteria for strong and weak primary mesenchyme cell (PMC) expression are defined in Figure 2. (C) Stacked bar plot showing a summary of GFP expression patterns of injected embryos scored at 48 hpf. Each spatial expression category is expressed as a percentage of total injected embryos.

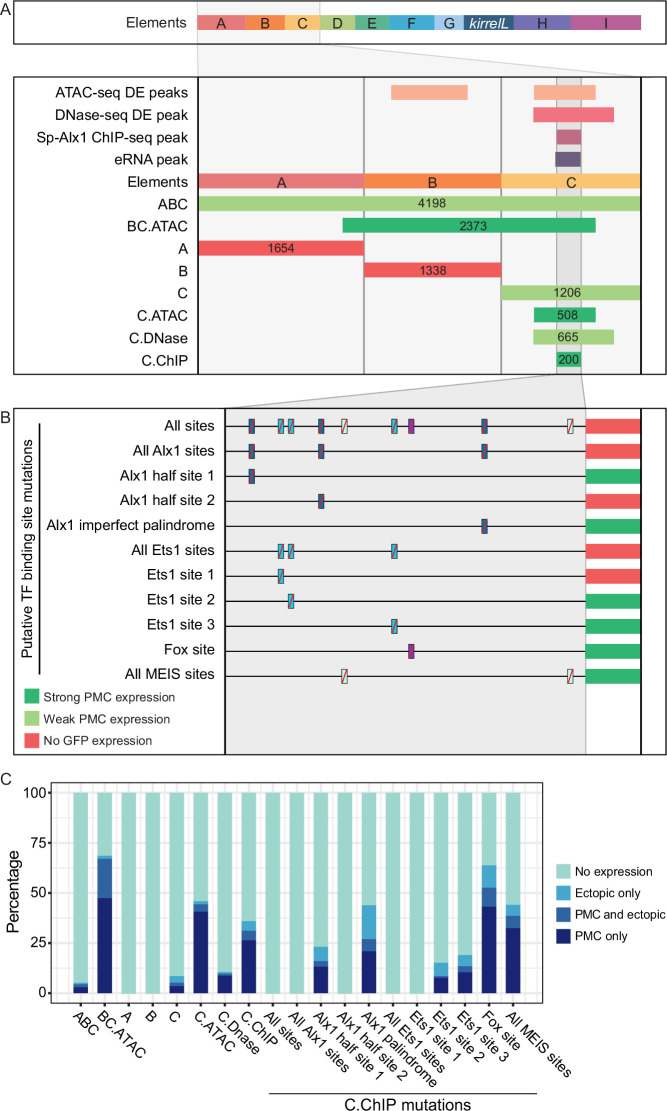
Figure 3.

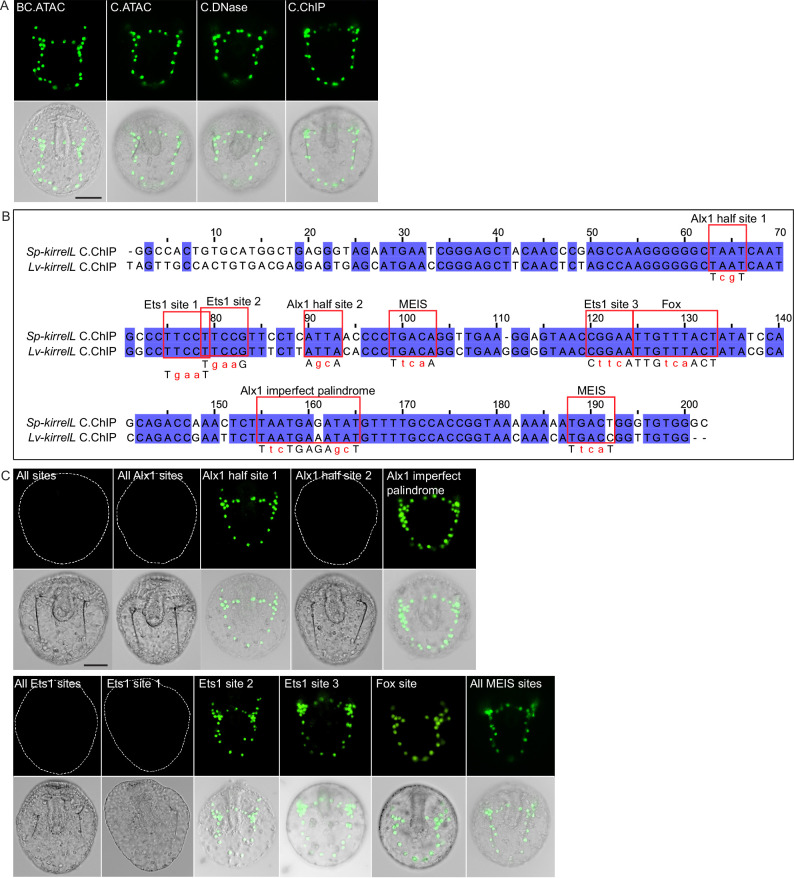
Figure 3—figure supplement 1. Element C truncation and mutational analysis.

Figure 3—figure supplement 1.

(A) Spatial expression patterns of GFP reporter constructs containing different element C truncations in embryos at 48 hpf. (B) Clustal alignment of Sp-kirrelL and Lv-kirrelL C.ChIP sequences. Violet shading indicates conserved sequences. Red boxes highlight putative transcription factor-binding sites. Mutations generated in binding sites are indicated in red letters below the aligned sequences. (C) Spatial expression patterns of GFP reporter constructs containing different C.ChIP element mutants at 48 hpf. Dotted lines show outlines of embryos that did not show GFP expression. Top rows: GFP fluorescence. Bottom rows: GFP fluorescence overlayed onto differential interference contrast (DIC) images. Scale bar: 50 μm.
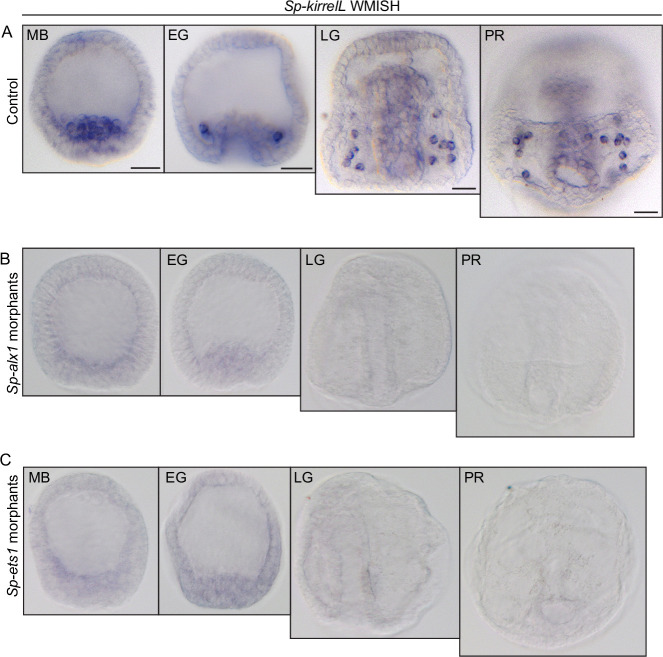
Figure 3—figure supplement 2. Effects of Sp-alx1 and Sp-ets1 knockdown on Sp-kirrelL expression.

Figure 3—figure supplement 2.

(A) Representative whole-mount in situ hybridization (WMISH) images showing Sp-kirrelL expression in the primary mesenchyme cells (PMCs) of uninjected control embryos. (B) Representative WMISH images showing lack of Sp-kirrelL expression in Sp-alx1 morphants. (C) Representative WMISH images showing lack of Sp-kirrelL expression in Sp-ets1 morphants. Scale bar: 20 μm. MB, mesenchyme blastula; EG, early gastrula; LG, late gastrula; PR, prism stage.