. 2022 Feb 25;11:e72834. doi: 10.7554/eLife.72834

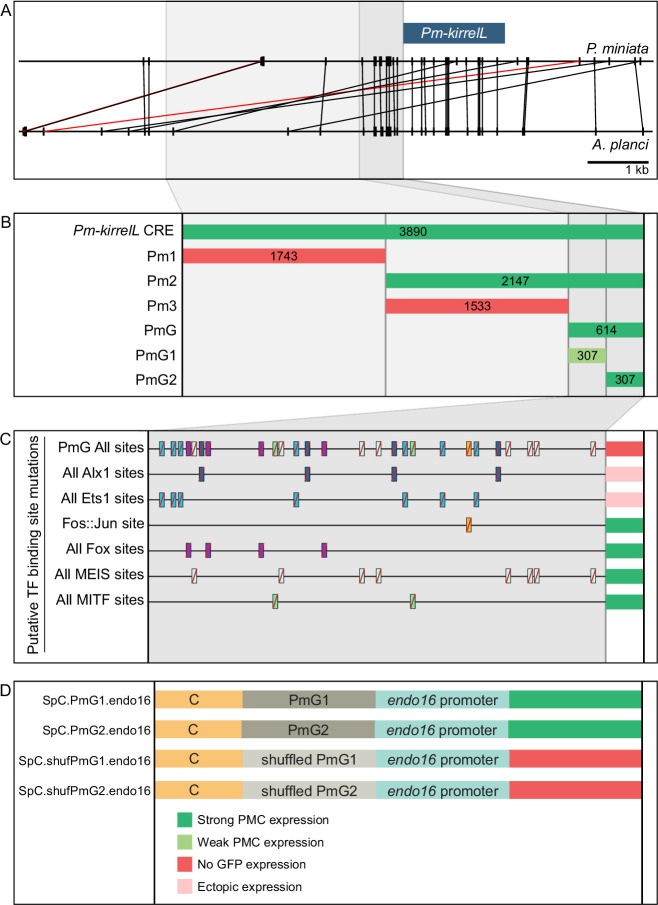
Figure 7. Functional analysis of noncoding genomic sequences upstream of Pm-kirrelL to identify cis-regulatory elements (CREs).

(A) Phylogenetic footprinting of genomic sequences near P. miniata and A. planci kirrelL using GenePalette. Black lines indicate identical sequences of 13 bp or longer in the same orientation while red lines indicate identical sequences of 13 bp or longer in the opposite orientation. (B) Summary of GFP expression regulated by noncoding sequences upstream of the Pm-kirrelL translational start site. (C) Summary of GFP expression driven by PmG element mutants. (D) Summary of GFP expression regulated by chimeric reporter constructs containing Sp-kirrelL element C and Pm-kirrelL G1 or G2 elements. Criteria for strong and weak primary mesenchyme cell (PMC) expression are defined in Figure 2. Ectopic expression is defined as majority of injected embryos exhibiting GFP expression in cells other than PMCs.

Figure 7.

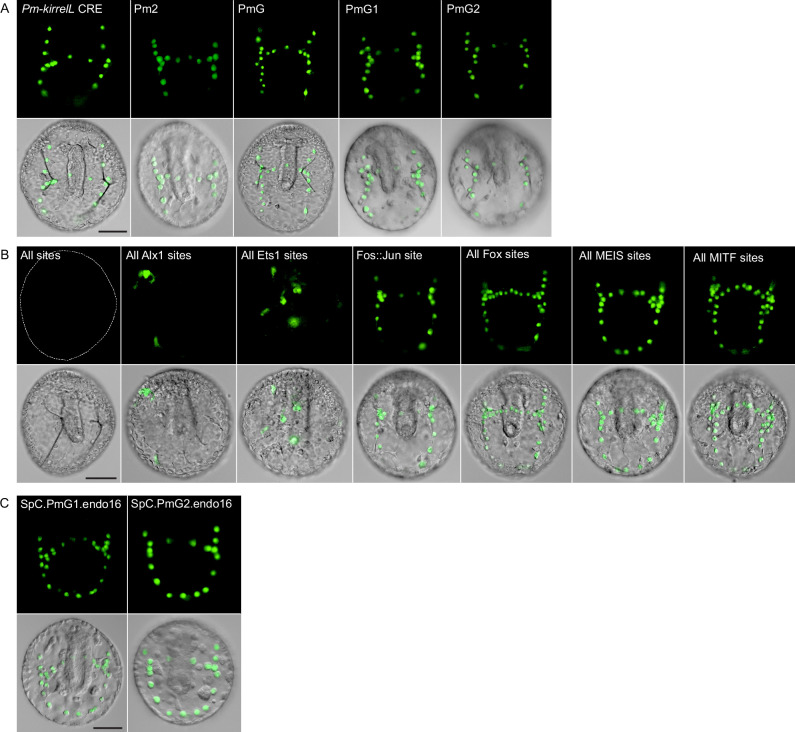
Figure 7—figure supplement 1. Sea star Pm-kirrelL cis-regulatory element (CRE) truncation and mutational analysis.

Figure 7—figure supplement 1.

(A) Spatial expression patterns of GFP reporter constructs containing Pm-kirrelL truncations in S. purpuratus embryos at 48 hpf. (B) Spatial expression patterns of GFP reporter constructs containing sea star PmG element mutants in S. purpuratus embryos at 48 hpf. (C) Spatial expression patterns of chimeric reporter constructs containing Sp-kirrelL element C and Pm-kirrelL G1 or G2 elements. Dotted lines show outlines of embryos that did not show GFP expression. Top rows: GFP fluorescence. Bottom rows: GFP fluorescence overlayed onto differential interference contrast (DIC) images. Scale bar: 50 μm.
Figure 7—figure supplement 2. Stacked bar plots showing summary of GFP expression patterns of injected embryos scored at 48 hpf.
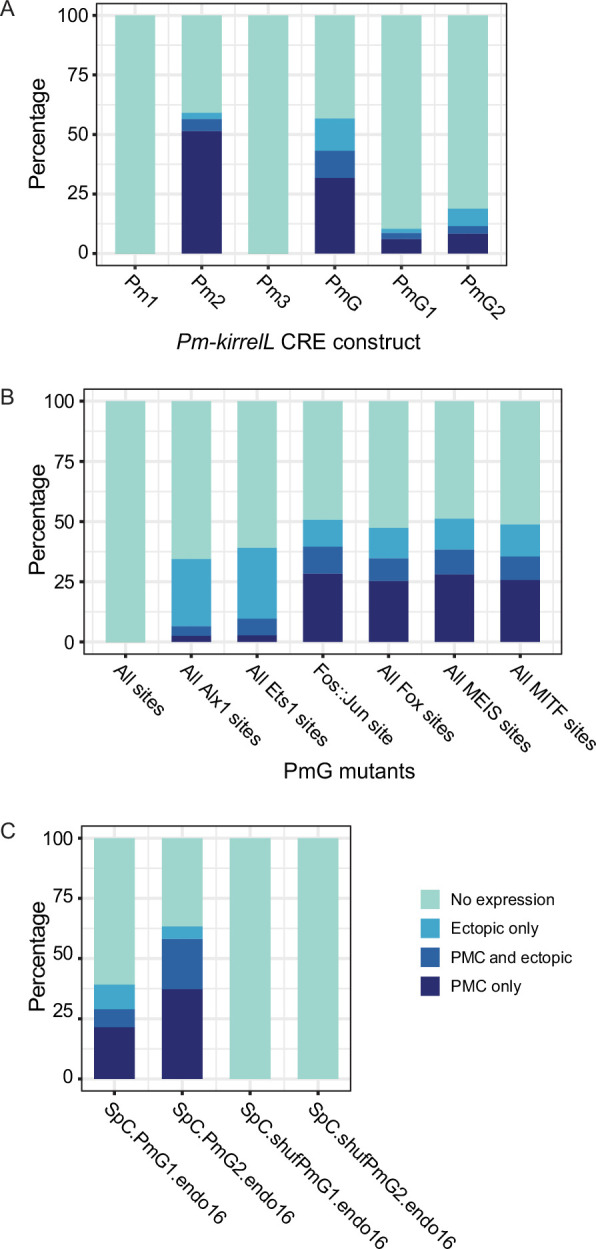
Figure 7—figure supplement 2.

Each spatial expression category is expressed as a percentage of total injected embryos. (A) GFP spatial expression patterns of transgenic embryos injected with Pm-kirrelL cis-regulatory element (CRE) reporter constructs. (B) GFP spatial expression patterns of embryos injected with PmG transcription factor-binding site mutant constructs. (C) GFP spatial expression patterns of embryos injected with constructs containing Sp-kirrelL C element with wild-type (WT) or shuffled Pm-kirrelL PmG1 or PmG2.
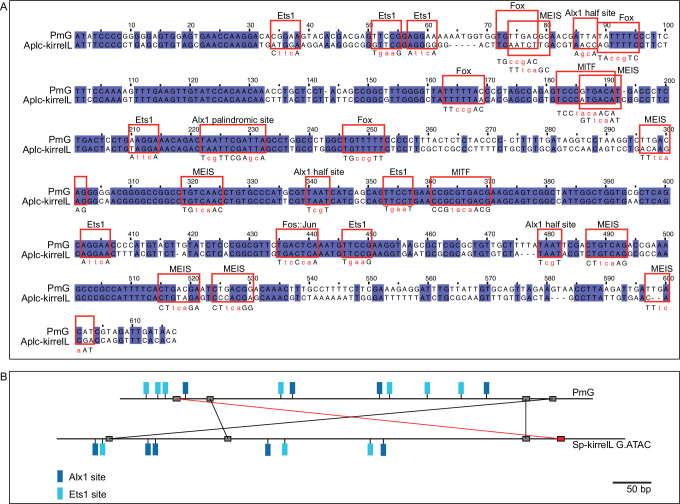
Figure 7—figure supplement 3. Mutational analysis of the sea star P. miniata kirrelL element G (PmG).

Figure 7—figure supplement 3.

(A) Clustal alignment of PmG and homologous sequences from crown-of-thorns starfish A. planci kirrelL element G (Aplc-kirrelL.G). Red boxes highlight putative transcription factor-binding sites. Sequences in red indicate transcription factor-binding site mutations that were generated. (B) Phylogenetic footprinting of PmG and Sp-kirrelL G.ATAC using GenePalette. Black lines indicate identical sequences of 9 bp or longer in the same orientation while red lines indicate identical sequences of 9 bp or longer in the opposite orientation.
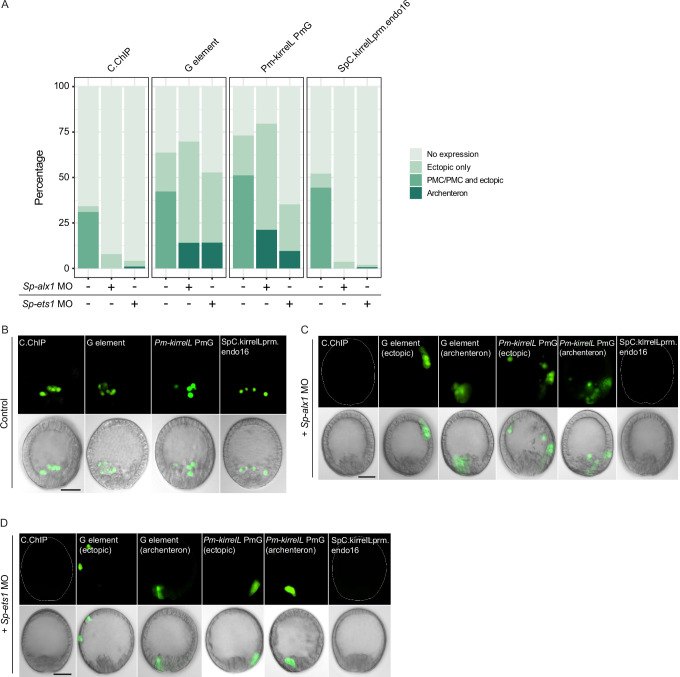
Figure 7—figure supplement 4. Effects of Sp-alx1 and Sp-ets1 knockdown on transgenic Sp-kirrelL cis-regulatory element (CRE) reporter construct expression.

Figure 7—figure supplement 4.

(A) Stacked bar plot showing a summary of GFP expression patterns of embryos coinjected with morpholino and reporter constructs. Each spatial expression category is expressed as a percentage of total injected embryos. Representative images of primary mesenchyme cell (PMC)-specific and ectopic GFP expression in control embryos (B), Sp-alx1 morphants (C), and Sp-ets1 morphants (D). Dotted lines show outlines of embryos that did not exhibit GFP expression. Top row: GFP fluorescence. Bottom row: GFP fluorescence overlayed onto differential interference contrast (DIC) images. Scale bar: 20 μm.