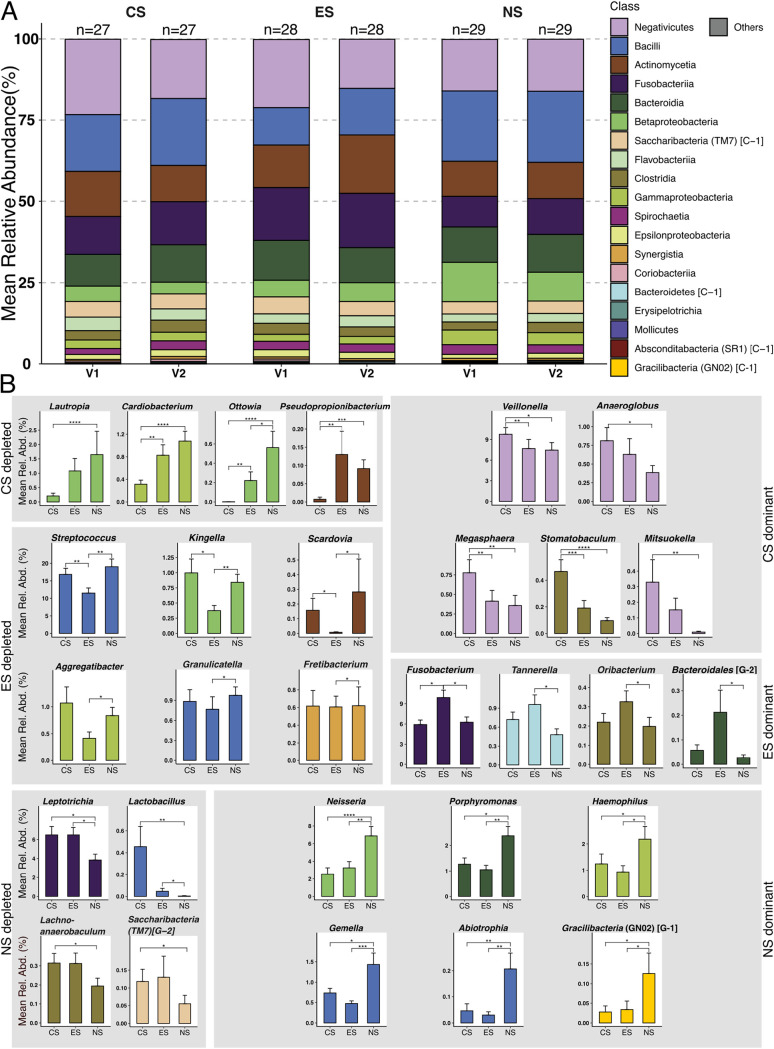
FIG 3.
Cohorts displayed distinct patterns in taxa mean relative abundance. Periodontal microbial community composition at the class level and genera-based differential relative abundance are shown for CS, ES, and NS. (A) Per-visit bar plots for relatively abundant classes in the different cohorts. (B) Statistically significant differentially relatively abundant genera grouped based on abundance patterns in the three cohorts (visits merged within a cohort) (Mann-Whitney U test; *, P < 0.05; **, P < 0.01; ***, P < 0.001). Rel. Abd., relative abundance.

