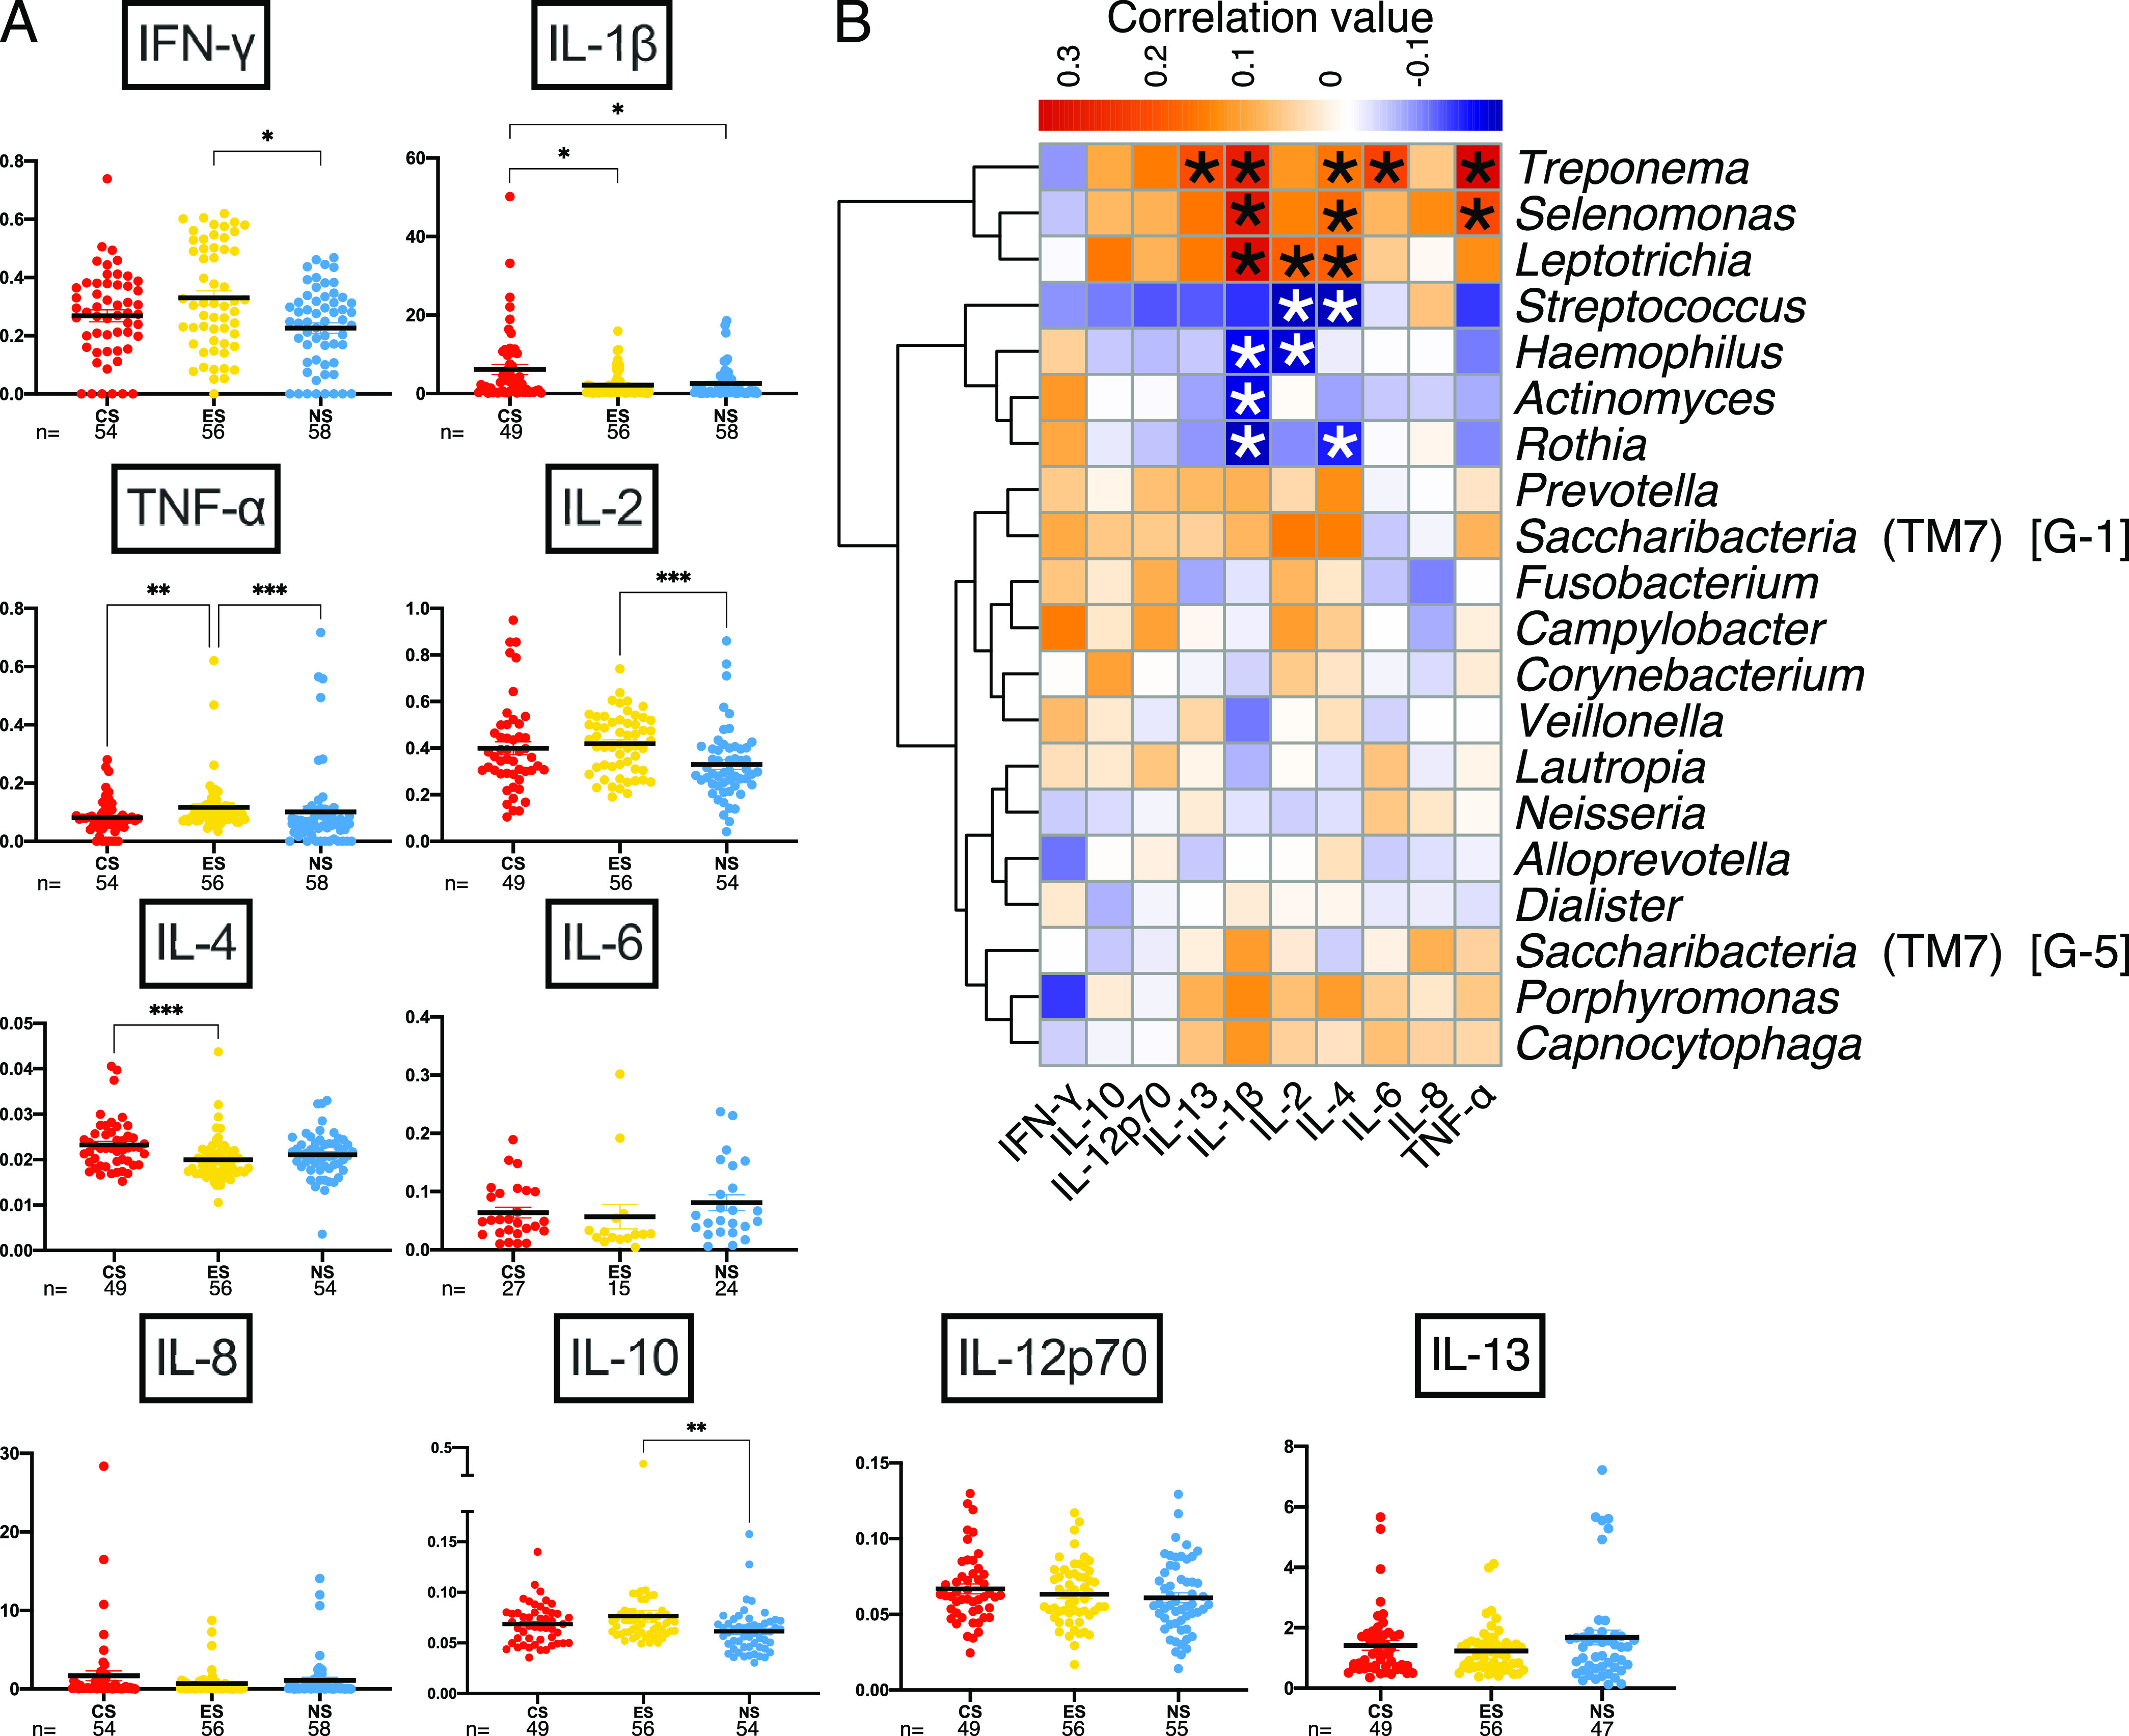
FIG 6.

Cytokine abundance patterns differ among cohorts, and cytokines positively correlate with known pathogens. (A) Cytokine concentrations (picograms per milliliter) for the three cohorts; sample numbers are displayed below cohort designation. Kruskal-Wallis H with post hoc Dunn’s test was performed, with multiplicity-adjusted P values reported. *, P < 0.05; **, P < 0.01; ***, P < 0.001. (B) Hierarchical-clustering correlation heat map with cytokines and the 20 most relatively abundant genera. *, P < 0.05.
