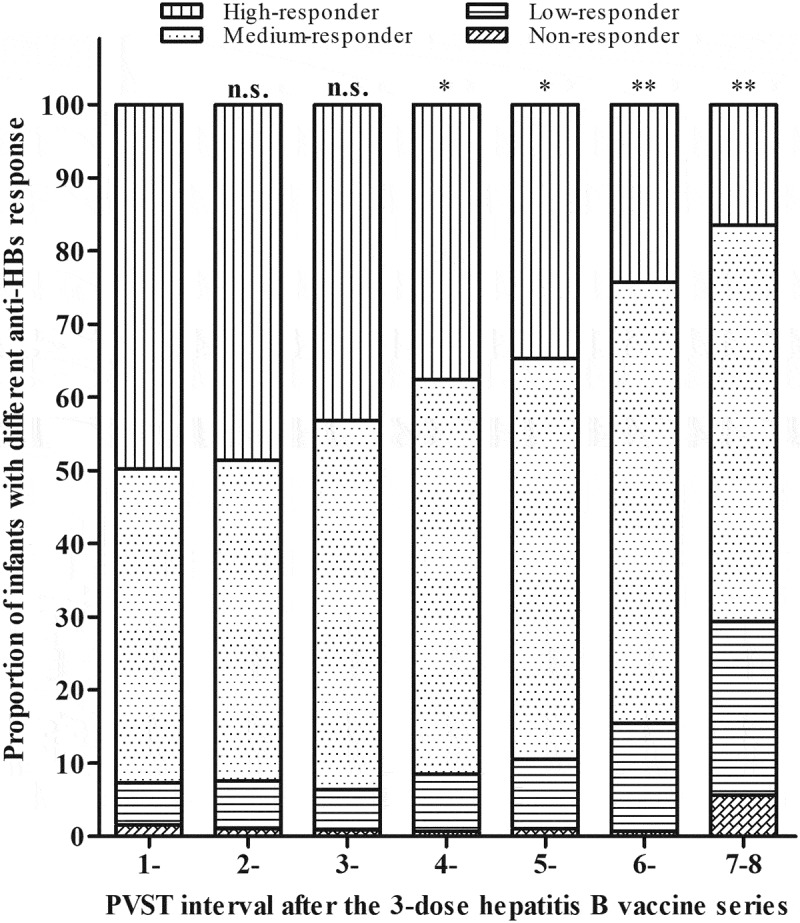
Figure 2.

Distribution of anti-HBs responses in infants with different PVST intervals. The proportions of high, medium, low, and non-responders in each interval were compared with 1 month of PVST interval. P values were determined using Mann–Whitney U tests. n.s., not statistically significant; *, P < .05; **, P < .001.
