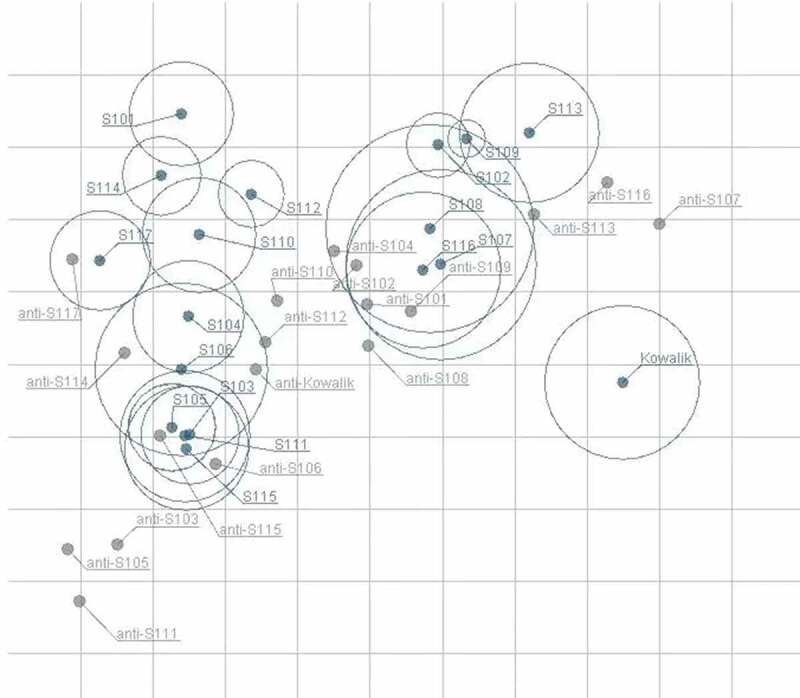
Figure 4.

Antigenic map of 18 anti-sera against 18 strains.
The relative positions of viral strains (blue points) and anti-sera (gray points) were adjusted such that the distances between strains and anti-sera in the map represent the corresponding neutralization titers. Outer circles of strains mean standard error. The space between grid lines is 1 unit of antigenic distance, corresponding to a 2-fold dilution of antiserum in the neutralization assay.
