FIG 4.
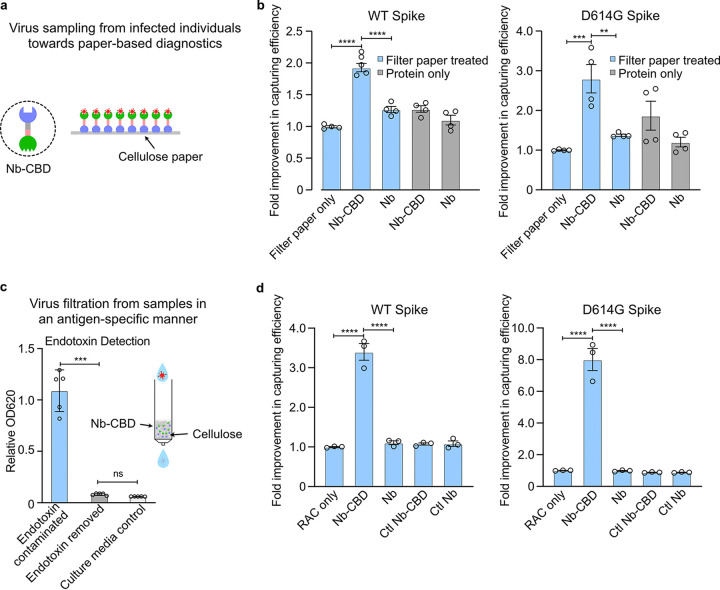
SARS-CoV-2 pseudovirus capture by Nb (Ty1)-CBD-immobilized cellulose in two different formats. (a) Schematic of increasing surface densities of Nb-CBD through protein immobilization on cellulose materials for SARS-CoV-2 neutralization. (b) Increased neutralization efficacy of pseudovirus through protein immobilization on cellulose paper over free proteins. After incubation of the pseudovirus with 200 μL of 10 μg/mL fusion protein Nb-CBD or Nb (negative control) immobilized on cellulose paper or free protein with equal concentrations, the titers of wild-type (WT) and D614G pseudoviruses were quantified by transducing HEK293T-hACE2 cells with the remaining viruses in the supernatant. Fold changes from each treatment group were normalized to that of filter paper only. (c) An in vitro cellular assay to confirm the complete removal of bacterial toxins from the Nb-CBD-functionalized RAC column. Bacterial toxins were removed in a single step with 0.1% Triton X-114. Flowthrough factions from Nb-CBD-functionalized RAC were added to RAW-Blue cells, an engineered murine macrophage cell line that can detect trace levels of endotoxin and other bacterial toxins. The secretion of a reporter protein, phosphatase, can indicate the presence of bacterial toxins as innate immune agonists. It was found that direct flowthrough fractions were indeed contaminated with bacterial toxins, denoted by “Endotoxin contaminated,” while flowthrough fractions from Triton X-114-treated RAC (denoted by “Endotoxin removed”) did not have detectable levels of toxins compared to the culture medium control. A schematic of an Nb-CBD-functionalized RAC column is shown in the inset. (d) Capture efficacy of Nb-CBD-functionalized RAC. The flowthrough samples from functionalized RAC columns were used to transduce HEK293T-hACE2 cells to quantify viral titers for WT and D614G SARS-CoV-2 pseudoviruses, respectively. Fold changes from each treatment group were normalized to that of RAC only. Graphs are expressed as mean ± SEM (n = 4) in panel b and as mean ± SEM (n = 3) in panel d. Statistical analysis was performed by one-way analysis of variance (ANOVA) according to the following scale: **, P < 0.01; ***, P < 0.001; and ****, P < 0.0001.

