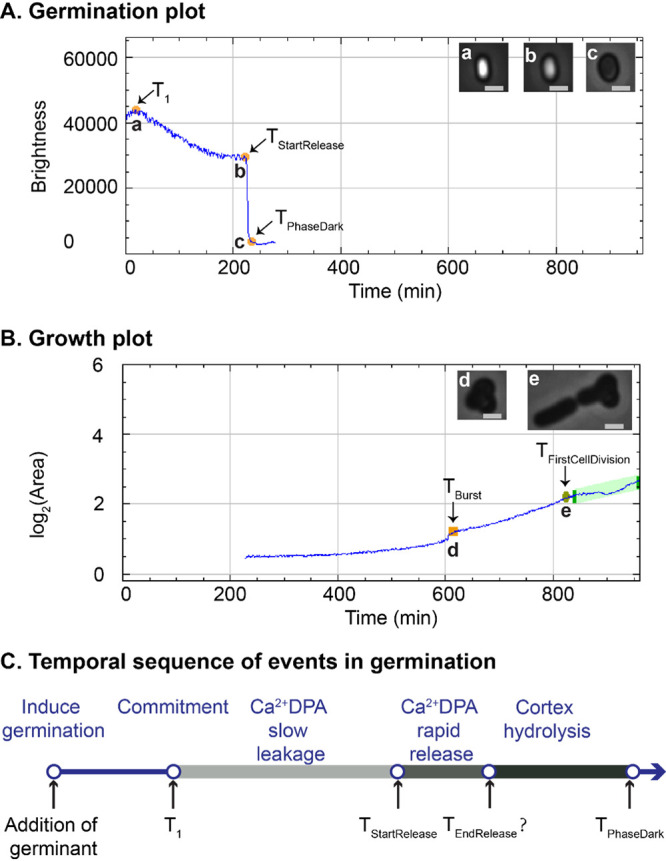
FIG 5.

Germination and growth plots of a single B. subtilis spore (treated at 80°C for 150 min), created by SporeTrackerX. (A) In the germination plot, two phases of brightness drop at different speeds were observed. The slow drop was considered the slow leakage of Ca2+-DPA. The fast drop was likely due to both the rapid Ca2+-DPA release and the subsequent cortex hydrolysis induced by the released Ca2+-DPA. The time of the start of rapid Ca2+-DPA release (TStartRelease), time of complete phase darkening (TPhaseDark), and time of the start of the slow drop in brightness (T1) were assessed during spore germination by SporeTrackerX. (B) The time of burst (TBurst) and time of first cell division (TFirstCellDivision) were determined, and the various events are marked in the growth plot. Micrographs of spores and cells at each time point are shown at the top right of panels A and B. The brightness display ranges for images a and b and images c to e are 0 to 40,000 and 0 to 25,000, respectively. Scale bar, 1 μm. (C). The temporal sequence of events in germination, adapted from the work of Wang et al. (19). The top shows the temporal sequence of germination events, and the bottom indicates the time points detected in the current work as shown in panel A. For the rapid Ca2+-DPA release, we only estimated its initiation from the germination plot.
