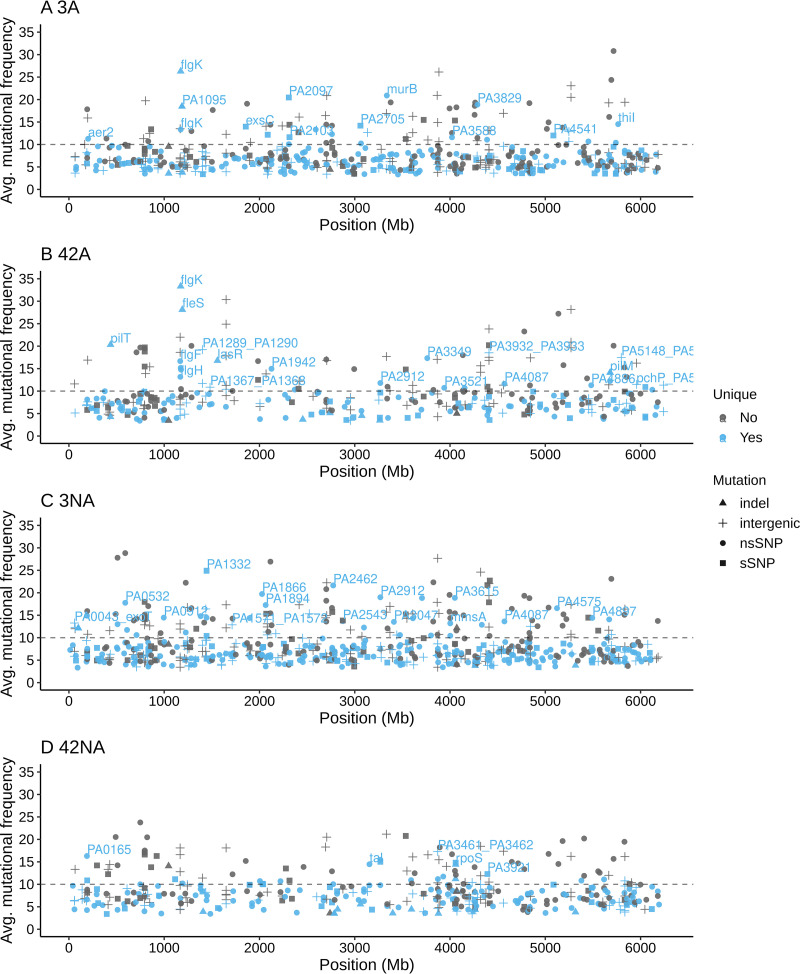
FIG 4.
Mutations in amoeba-adapted and nonadapted P. aeruginosa on days 3 and 42. The average mutational frequencies of three replicate populations (L1, L2, and L3) of day 3 adapted (A), day 42 adapted (B), day 3 nonadapted (C), and day 42 nonadapted (D) populations are plotted along the P. aeruginosa genome. Different symbols represent different types of mutation. The unique mutations (those detected in either adapted or nonadapted populations) are blue, while gray denotes mutations found in all groups.

