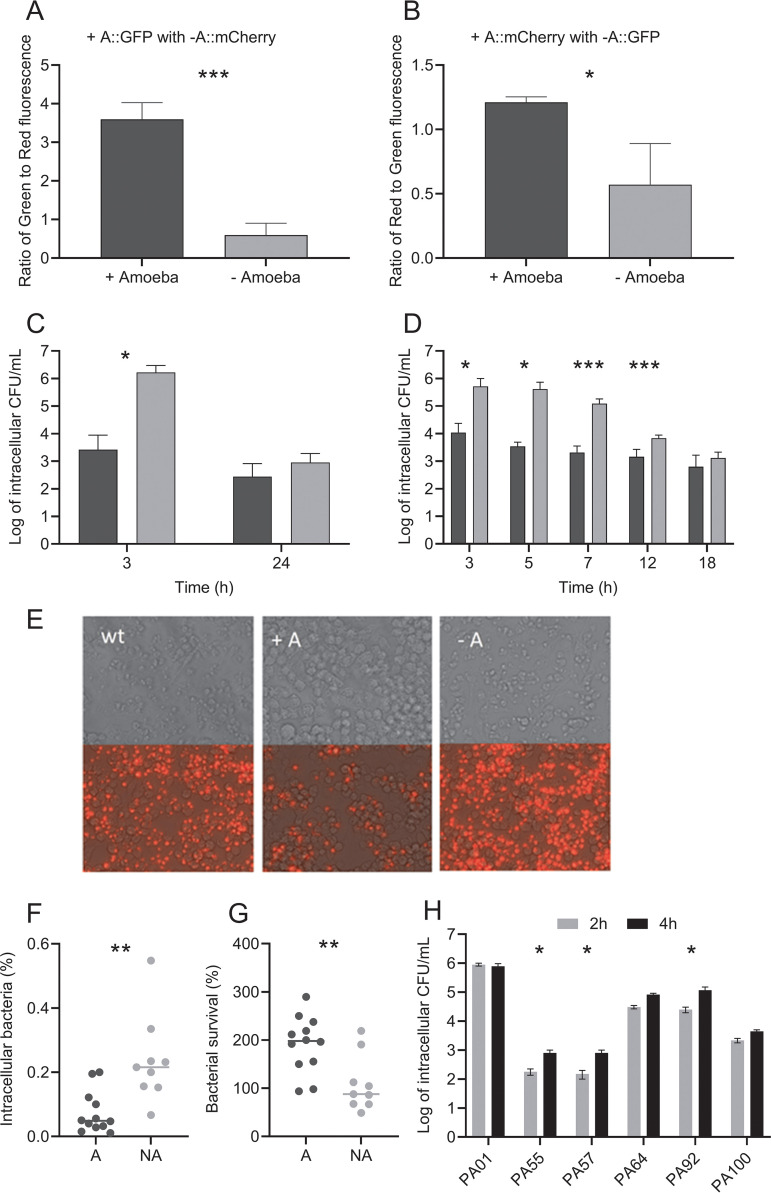
FIG 5.
Competition and intracellular survival assays of amoeba-adapted and nonadapted isolates. The fluorescence ratios of day 42 amoeba-adapted (+A::GFP) mixed with nonadapted (−A::mCherry) P. aeruginosa (A) and amoeba-adapted (+A::mCherry) with nonadapted (−A::GFP) P. aeruginosa (B) after 48 h of incubation with (black bars) and without (gray bars) A. castellanii. Intracellular survival of day 42 amoeba-adapted (black) and nonadapted (gray) isolates is shown as CFU mL−1 over time in a modified gentamicin protection assay (log scale; n = 3) conducted with amoebae (C) and macrophages (D). Propidium iodide staining of RAW 264.7 macrophages 24 h after infection with wild-type (wt), day 42 amoeba-adapted (A+), and nonadapted (−A) P. aeruginosa (E). Images are shown with and without the fluorescence to illustrate changes in cell morphology. Survival of day 42 amoeba-adapted (A) and nonadapted (NA) strains following incubation with human neutrophils where bacterial uptake (F) and survival (G) were determined. Intracellular numbers of CF isolates at 2 and 4 h of infection with amoebae were determined (H). The 4-h/2-h ratios were used to determine the significance of intracellular survival compared to that of PAO1 using the Kruskal-Wallis test. Data are means and SEM. Groups were analyzed by Student's t test. *, P < 0.05; **, P < 0.01; ***, P < 0.001.

